วิธีสร้าง quiver plot ใน matplotlib (พร้อมตัวอย่าง)
แผนภาพสั่น เป็นประเภทของพล็อตที่แสดงลูกศรที่มีส่วนประกอบทิศทาง U และ V ที่พิกัดคาร์ทีเซียนที่ระบุโดย X และ Y
เราสามารถสร้างพล็อตแบบสั่นใน Matplotlib ได้อย่างง่ายดายโดยใช้ฟังก์ชัน quiver() ซึ่งใช้ไวยากรณ์ต่อไปนี้:
สั่น (x, y, u, v)
ทอง:
- x: พิกัด x ของตำแหน่งลูกศร
- y: พิกัด y ของตำแหน่งลูกศร
- u: องค์ประกอบ x ของเวกเตอร์ลูกศร
- v: องค์ประกอบ y ของเวกเตอร์ลูกศร
บทช่วยสอนนี้มีตัวอย่างการใช้งานฟังก์ชันนี้ในทางปฏิบัติหลายตัวอย่าง
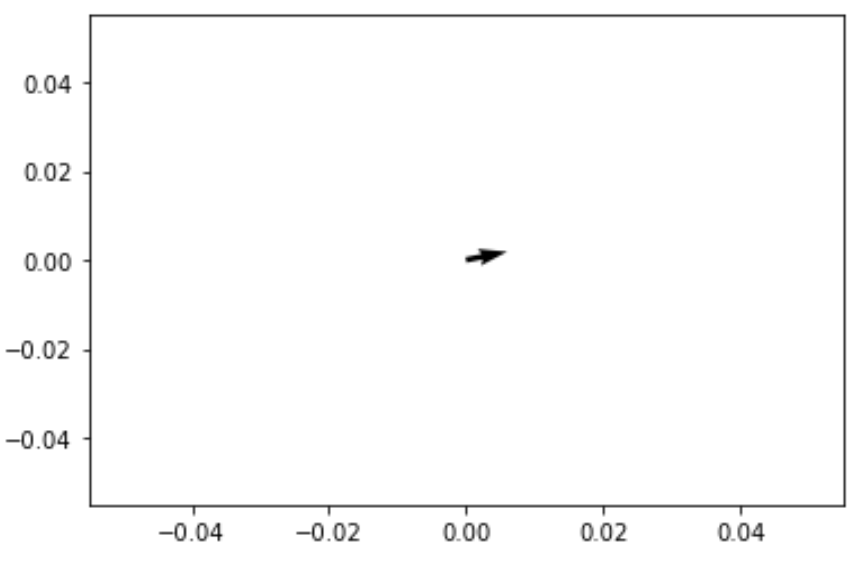
ตัวอย่างที่ 1: การวาดตัวสั่นด้วยลูกศรดอกเดียว
รหัสต่อไปนี้แสดงวิธีการแสดงพล็อตสั่นด้วยลูกศรเดียว:
 import matplotlib. pyplot as plt

#define plots
fig, ax = plt. subplots ()

#define coordinates and directions
x = 0
y = 0
u = 15
v = 3

#create quiver plot
ax. quiver (x, y, u, v)

#display quiver plot
plt. show ()

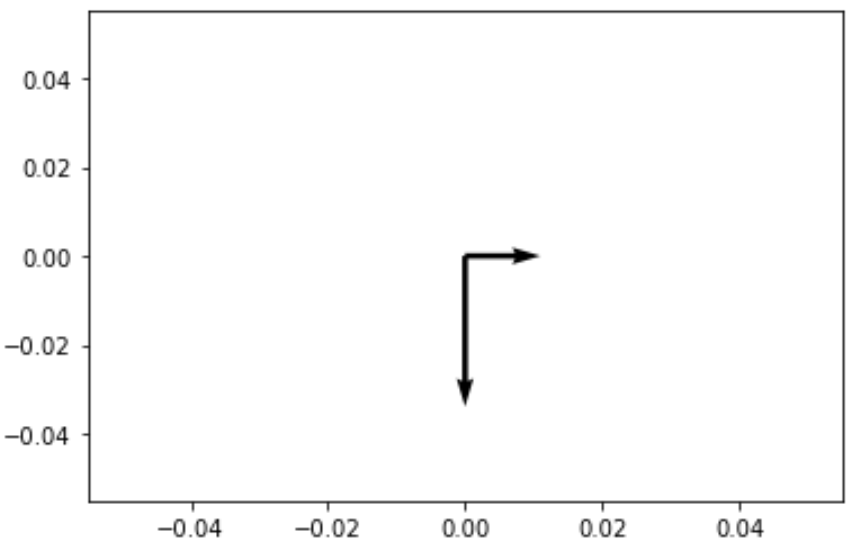
ตัวอย่างที่ 2: เค้าโครงตัวสั่นที่มีลูกศรสองอัน
รหัสต่อไปนี้แสดงวิธีการแสดงพล็อตสั่นด้วยลูกศรสองอัน:
 import matplotlib. pyplot as plt

#define plots
fig, ax = plt. subplots ()

#define coordinates and directions
x = [0, 0]
y = [0, 0]
u = [0, 1]
v = [-2, 0]
#create quiver plot
ax. quiver (x, y, u, v, scale = 10 )

#display quiver plot
plt. show ()

โปรดทราบว่าอาร์กิวเมนต์ มาตราส่วน จะปรับขนาดลูกศรให้ยาวขึ้น ทำให้มองเห็นได้ง่ายขึ้นบนโครงเรื่อง
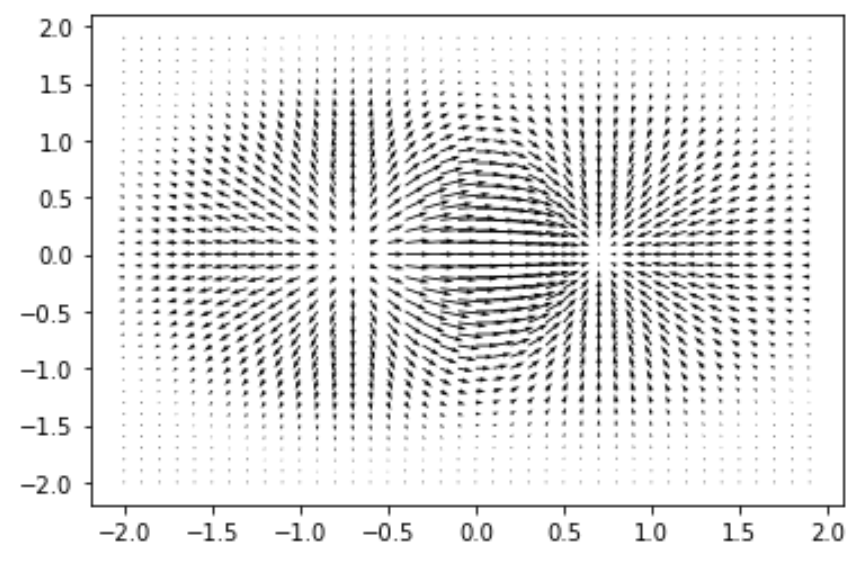
ตัวอย่างที่ 3: พล็อตสั่นด้วยตารางตาข่าย
รหัสต่อไปนี้แสดงวิธีการแสดงพล็อตสั่นโดยใช้ตารางตาข่าย:
 import matplotlib. pyplot as plt
import numpy as np

#define plots
fig, ax = plt. subplots ()

#define coordinates and directions
x,y = np. meshgrid (np. arange (-2, 2, .1), np. arange (-2, 2, .1))
z = x*np. exp (-x**2 - y**2)
v, u = np. gradient (z, .1, .1)

#create quiver plot
ax. quiver (x, y, u, v)

#display quiver plot
plt. show ()

คุณสามารถดูเอกสารฉบับเต็มของฟังก์ชัน quiver() ได้ที่นี่