วิธีเปลี่ยนตำแหน่งของคำอธิบายแผนภูมิใน matplotlib
หากต้องการเปลี่ยนตำแหน่งของคำอธิบายแผนภูมิใน Matplotlib คุณสามารถใช้ฟังก์ชัน plt.legend() ได้
ตัวอย่างเช่น คุณสามารถใช้ไวยากรณ์ต่อไปนี้เพื่อวางคำอธิบายไว้ที่มุมซ้ายบนของโครงเรื่อง:
plt. legend (loc=' upper left ')
ตำแหน่งเริ่มต้นคือ “ดีที่สุด” ซึ่งเป็นจุดที่ Matplotlib ค้นหาตำแหน่งสำหรับคำอธิบายแผนภูมิโดยอัตโนมัติ โดยขึ้นอยู่กับตำแหน่งที่หลีกเลี่ยงการครอบคลุมจุดข้อมูล
อย่างไรก็ตาม คุณสามารถระบุตำแหน่งคำอธิบายภาพอย่างใดอย่างหนึ่งต่อไปนี้:
- ขวาบน
- ที่มุมบนซ้าย
- ที่ด้านซ้ายล่าง
- ที่มุมขวาล่าง
- ขวา
- ตรงกลางซ้าย
- ตรงกลางขวา
- ตรงกลางด้านล่าง
- ศูนย์ด้านบน
- ศูนย์
คุณยังสามารถใช้อาร์กิวเมนต์ bbox_to_anchor() เพื่อวางคำอธิบายไว้นอกโครงเรื่องได้ ตัวอย่างเช่น คุณสามารถใช้ไวยากรณ์ต่อไปนี้เพื่อวางคำอธิบายไว้ที่มุมขวาบนด้านนอกของพล็อต:
plt. legend (bbox_to_anchor=( 1.05 , 1 ), loc=' upper left ', borderaxespad= 0 )
ตัวอย่างต่อไปนี้แสดงวิธีการใช้แต่ละวิธีในทางปฏิบัติ
ตัวอย่างที่ 1: เปลี่ยนตำแหน่งของคำอธิบายแผนภูมิภายในพล็อต Matplotlib
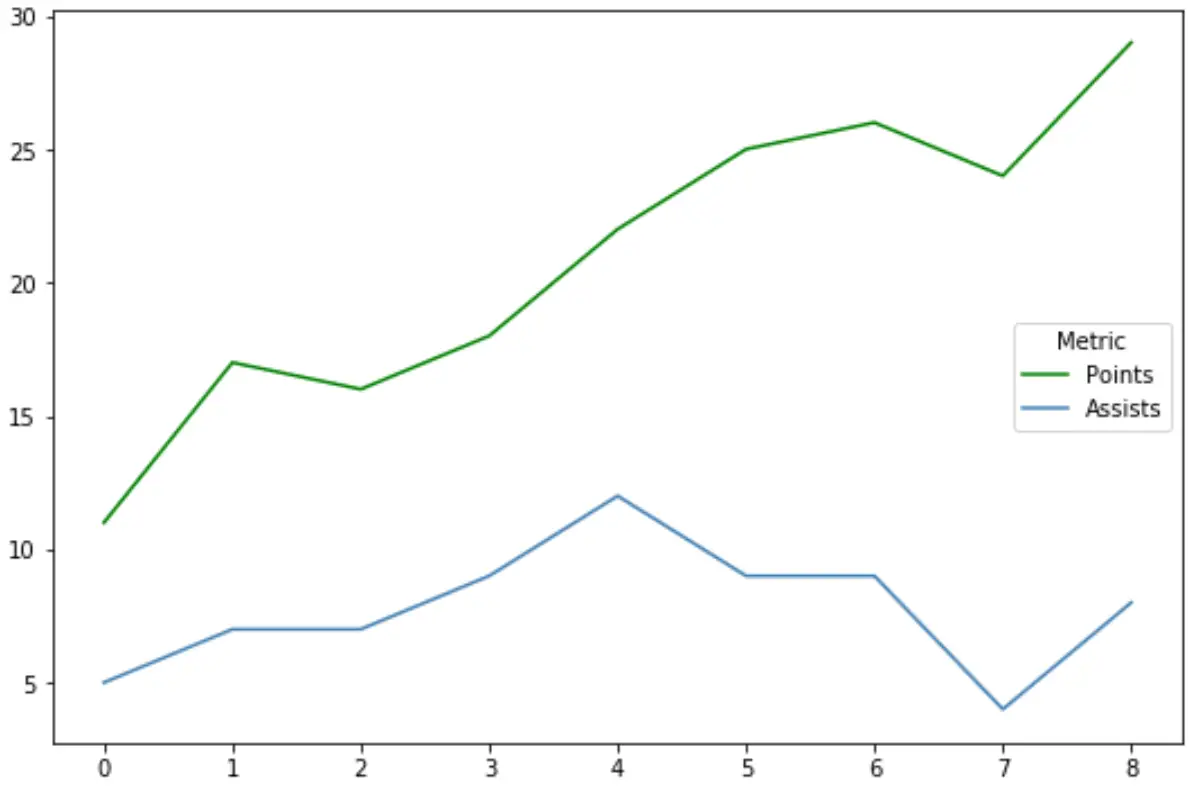
รหัสต่อไปนี้แสดงวิธีวางคำอธิบายในส่วนกึ่งกลางด้านขวาของพล็อตบรรทัด Matplotlib:
 import pandas as pd
import matplotlib. pyplot as plt

#createdata
df = pd. DataFrame ({' points ': [11, 17, 16, 18, 22, 25, 26, 24, 29],
                   ' assists ': [5, 7, 7, 9, 12, 9, 9, 4, 8]})

#add lines to plot
plt. plot (df[' points '], label=' Points ', color=' green ')
plt. plot (df[' assists '], label=' Assists ', color=' steelblue ')

#place legend in center right of plot
plt. legend (loc=' center right ', title=' Metric ')

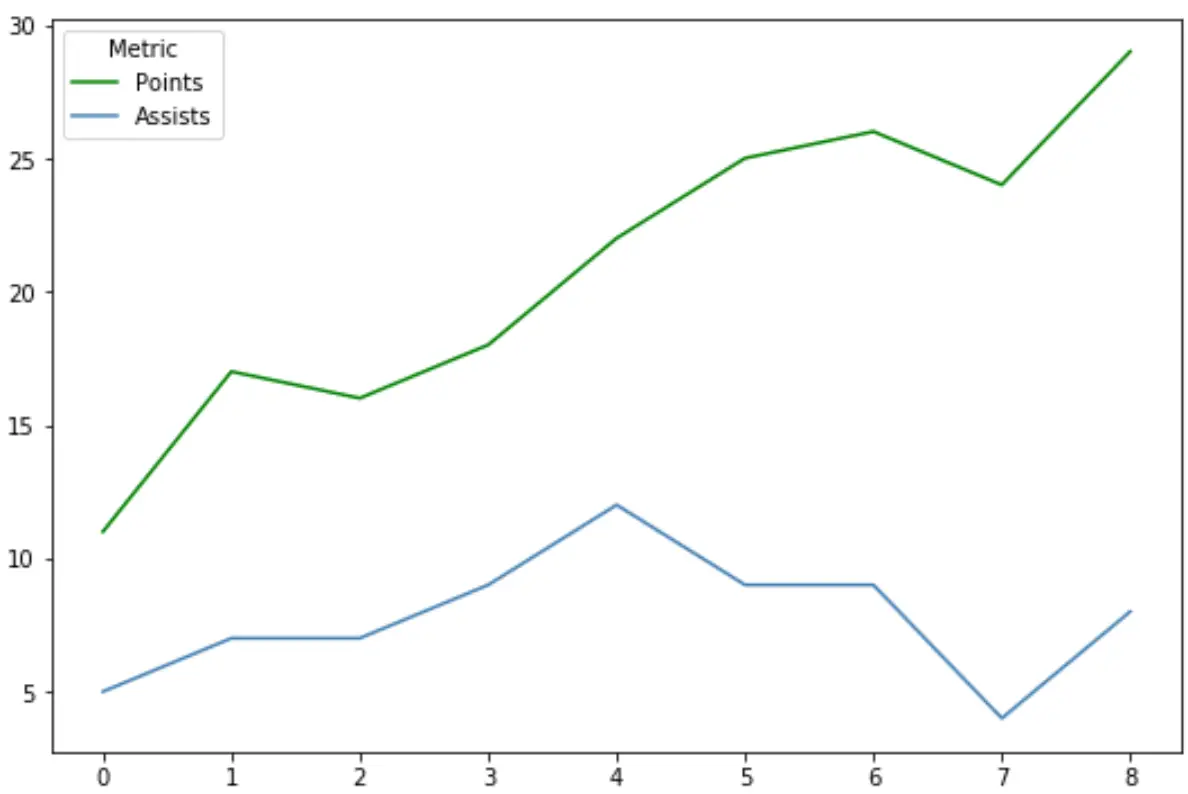
และโค้ดต่อไปนี้แสดงวิธีวางคำอธิบายไว้ที่ด้านซ้ายบนของพล็อต Matplotlib:
 import pandas as pd
import matplotlib. pyplot as plt

#create data
df = pd. DataFrame ({' points ': [11, 17, 16, 18, 22, 25, 26, 24, 29],
                   ' assists ': [5, 7, 7, 9, 12, 9, 9, 4, 8]})

#add lines to plot
plt. plot (df[' points '], label=' Points ', color=' green ')
plt. plot (df[' assists '], label=' Assists ', color=' steelblue ')

#place legend in center right of plot
plt. legend (loc=' upper left ', title=' Metric ')

ตัวอย่างที่ 2: เปลี่ยนตำแหน่งของคำอธิบายแผนภูมิภายนอกพล็อต Matplotlib
หากต้องการวางคำอธิบายไว้นอกพล็อต Matplotlib เราสามารถใช้อาร์กิวเมนต์ bbox_to_anchor()
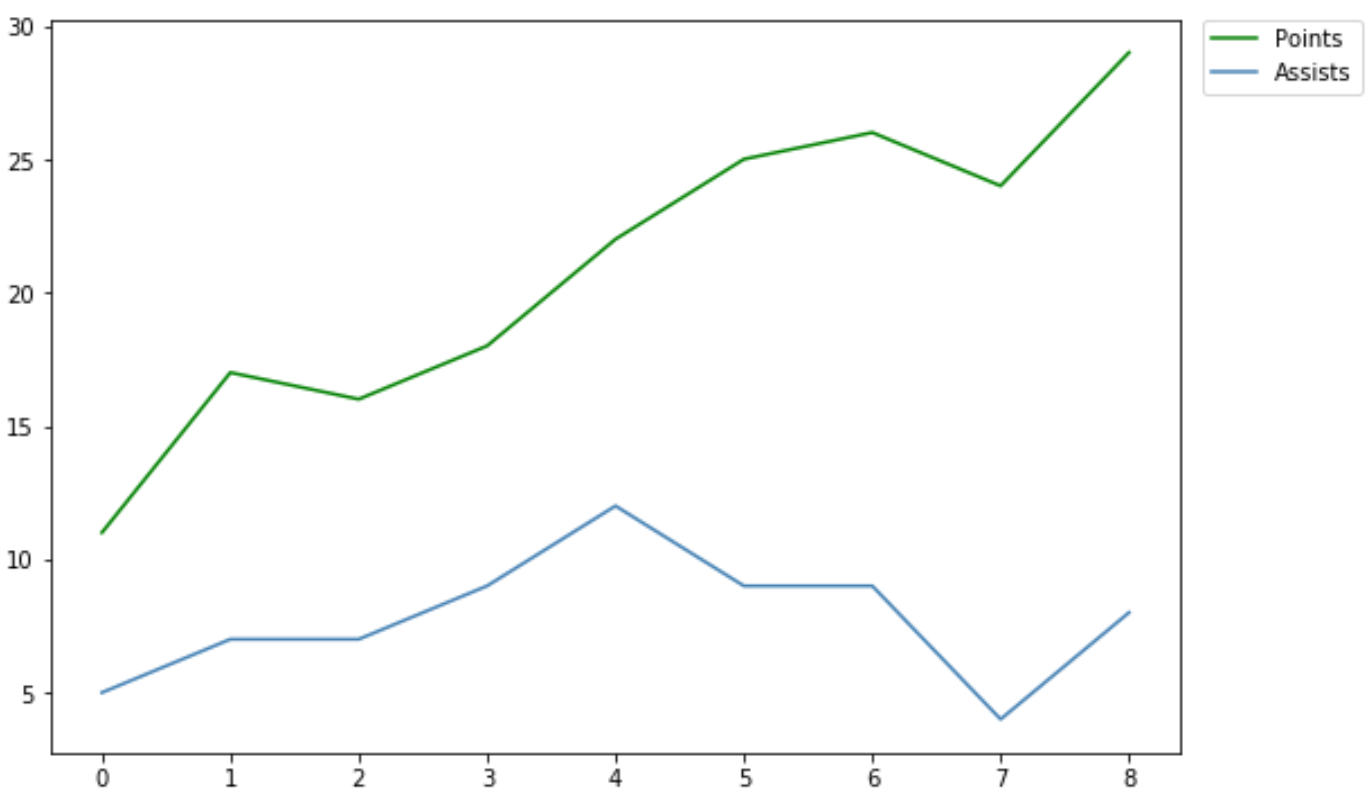
ตัวอย่างเช่น ต่อไปนี้คือวิธีวางคำอธิบายไว้ด้านนอกมุมขวาบนของโครงเรื่อง:
 import pandas as pd
import matplotlib. pyplot as plt

#create data
df = pd. DataFrame ({' points ': [11, 17, 16, 18, 22, 25, 26, 24, 29],
                   ' assists ': [5, 7, 7, 9, 12, 9, 9, 4, 8]})

#add lines to plot
plt. plot (df[' points '], label=' Points ', color=' green ')
plt. plot (df[' assists '], label=' Assists ', color=' steelblue ')

#place legend in center right of plot
plt. legend (bbox_to_anchor=( 1.02 , 1 ), loc=' upper left ', borderaxespad= 0 )

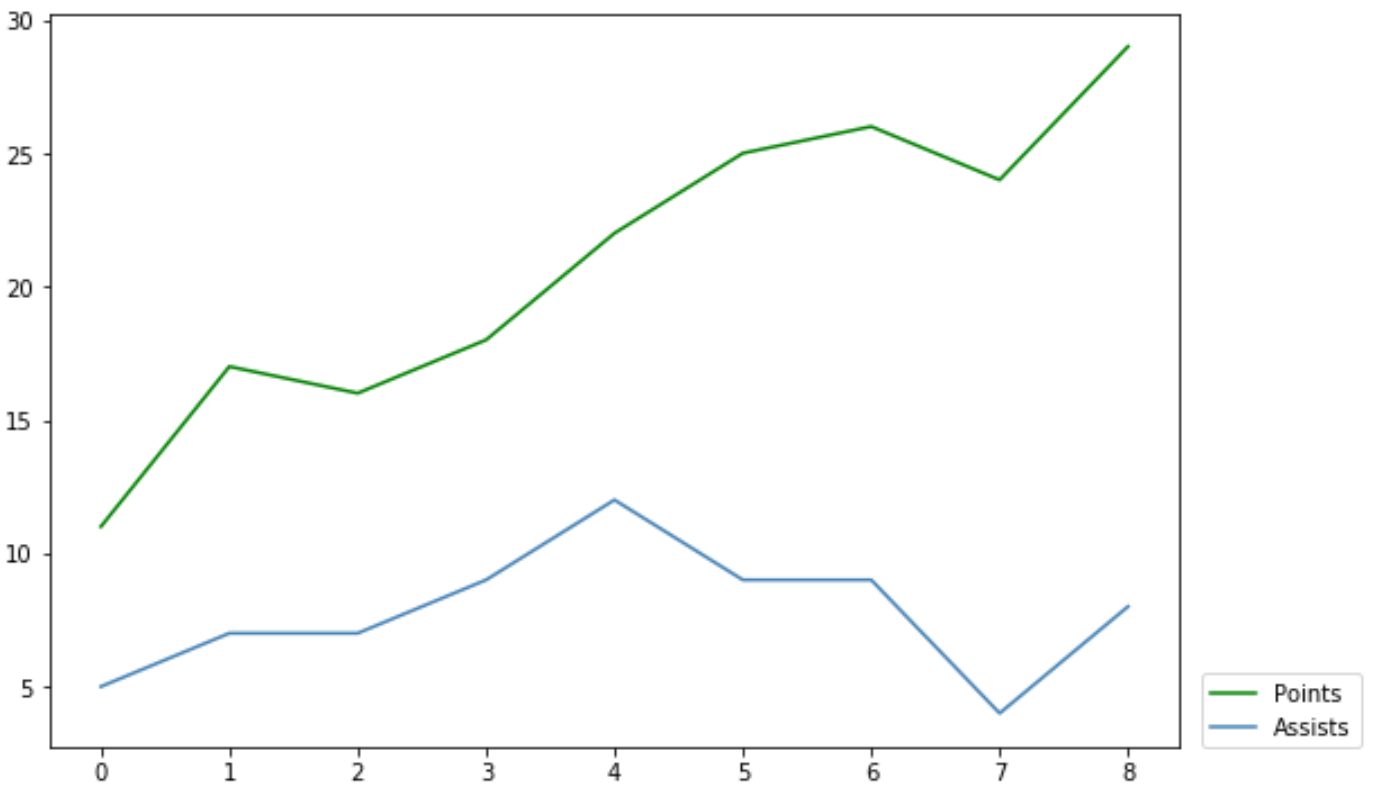
และต่อไปนี้คือวิธีวางคำอธิบายไว้ด้านนอกมุมขวาล่างของโครงเรื่อง:
 import pandas as pd
import matplotlib. pyplot as plt

#create data
df = pd. DataFrame ({' points ': [11, 17, 16, 18, 22, 25, 26, 24, 29],
                   ' assists ': [5, 7, 7, 9, 12, 9, 9, 4, 8]})

#add lines to plot
plt. plot (df[' points '], label=' Points ', color=' green ')
plt. plot (df[' assists '], label=' Assists ', color=' steelblue ')

#place legend in center right of plot
plt. legend (bbox_to_anchor=( 1.02 , 0.1 ), loc=' upper left ', borderaxespad= 0 )

โปรดดู เอกสารประกอบของ matplotlib สำหรับคำอธิบายโดยละเอียดของอาร์กิวเมนต์ bbox_to_anchor()
แหล่งข้อมูลเพิ่มเติม
บทช่วยสอนต่อไปนี้จะอธิบายวิธีดำเนินการทั่วไปอื่นๆ ใน Matplotlib:
วิธีเปลี่ยนขนาดตัวอักษรคำอธิบายแผนภูมิใน Matplotlib
วิธีเพิ่มชื่อให้กับคำอธิบายแผนภูมิใน Matplotlib
วิธีปรับตำแหน่งหัวเรื่องใน Matplotlib
วิธีปรับตำแหน่งป้ายกำกับแกนใน Matplotlib