วิธีแสดงเปอร์เซ็นต์บนแกน y ของฮิสโตแกรมของ pandas
คุณสามารถใช้ไวยากรณ์พื้นฐานต่อไปนี้เพื่อแสดงเปอร์เซ็นต์บนแกน y ของฮิสโตแกรมแพนด้า:
 import pandas as pd
import numpy as np
import matplotlib. pyplot as plt
from matplotlib. ticker import PercentFormatter

#create histogram, using percentages instead of counts
plt. hist (df[' my_column '], weights= np.ones ( len (df)) / len (df))

#apply percentage format to y-axis
plt. gca (). yaxis . set_major_formatter (PercentFormatter(1))
plt. show ()
ตัวอย่างต่อไปนี้แสดงวิธีใช้ไวยากรณ์นี้ในทางปฏิบัติ
ตัวอย่าง: แสดงเปอร์เซ็นต์บนแกน Y ของฮิสโตแกรมของ Pandas
สมมติว่าเรามี DataFrame แพนด้าต่อไปนี้ซึ่งมีข้อมูลเกี่ยวกับผู้เล่นบาสเกตบอลต่างๆ:
 import pandas as pd
import numpy as np

#make this example reproducible
n.p. random . seeds (1)

#createDataFrame
df = pd. DataFrame ({' points ': np. random . normal (loc=20, scale=2, size=300),
                   ' assists ': np. random . normal (loc=14, scale=3, size=300),
                   ' rebounds ': np. random . normal (loc=12, scale=1, size=300)})

#view head of DataFrame
print ( df.head ())

      points assists rebounds
0 23.248691 20.197350 10.927036
1 18.776487 9.586529 12.495159
2 18.943656 11.509484 11.047938
3 17.854063 11.358267 11.481854
4 21.730815 13.162707 10.538596
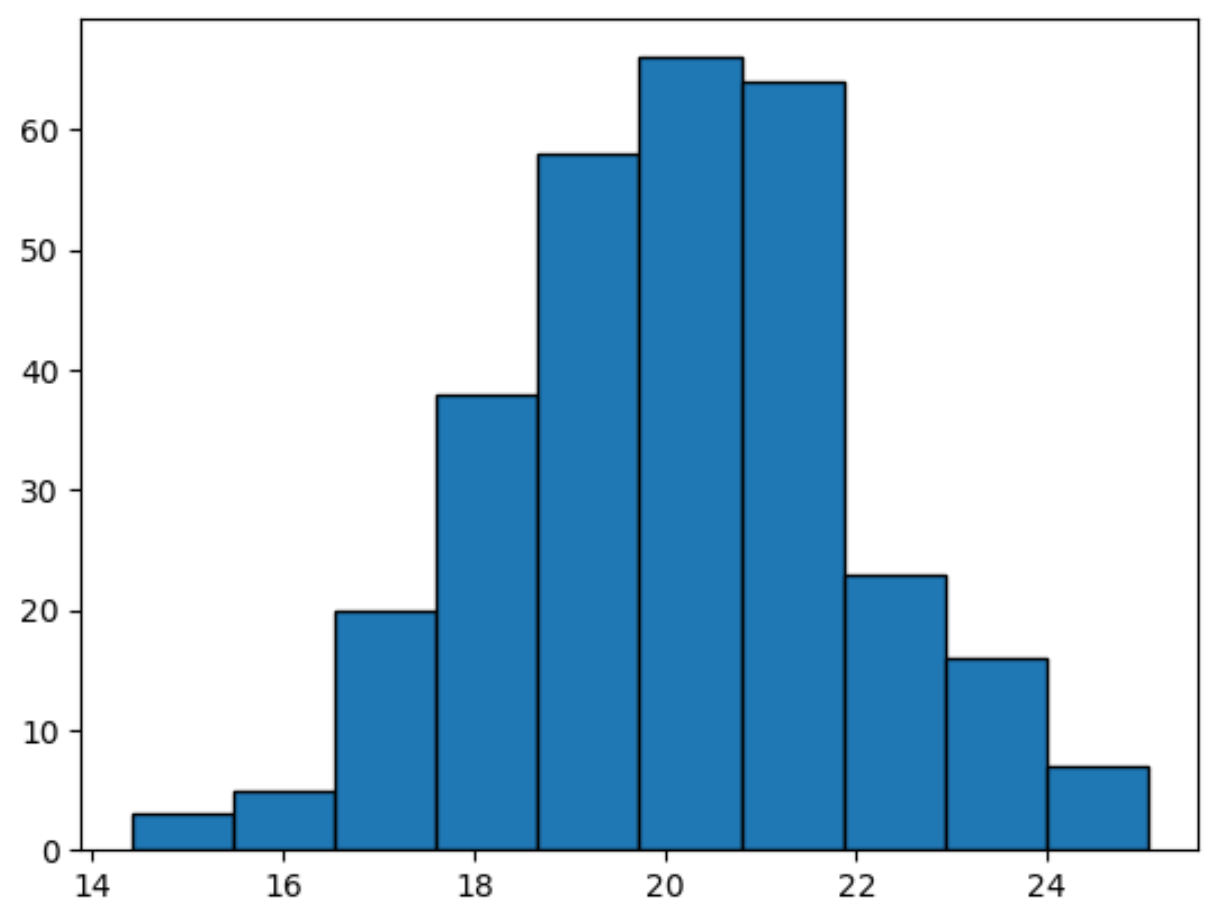
หากเราสร้างฮิสโตแกรมเพื่อแสดงภาพการกระจายของค่าในคอลัมน์ จุด แกน y จะแสดงจำนวนตามค่าเริ่มต้น:
 import matplotlib. pyplot as plt

#create histogram for points columb
plt. hist (df[' points '], edgecolor=' black ')
หากต้องการแสดงเปอร์เซ็นต์บนแกน y แทน เราสามารถใช้ฟังก์ชัน PercentFormatter ได้:
 import numpy as np
import matplotlib. pyplot as plt
from matplotlib. ticker import PercentFormatter

#create histogram, using percentages instead of counts
plt. hist (df[' points '], weights=np. ones ( len (df)) / len (df), edgecolor=' black ')

#apply percentage format to y-axis
plt. gca (). yaxis . set_major_formatter (PercentFormatter(1))
plt. show ()
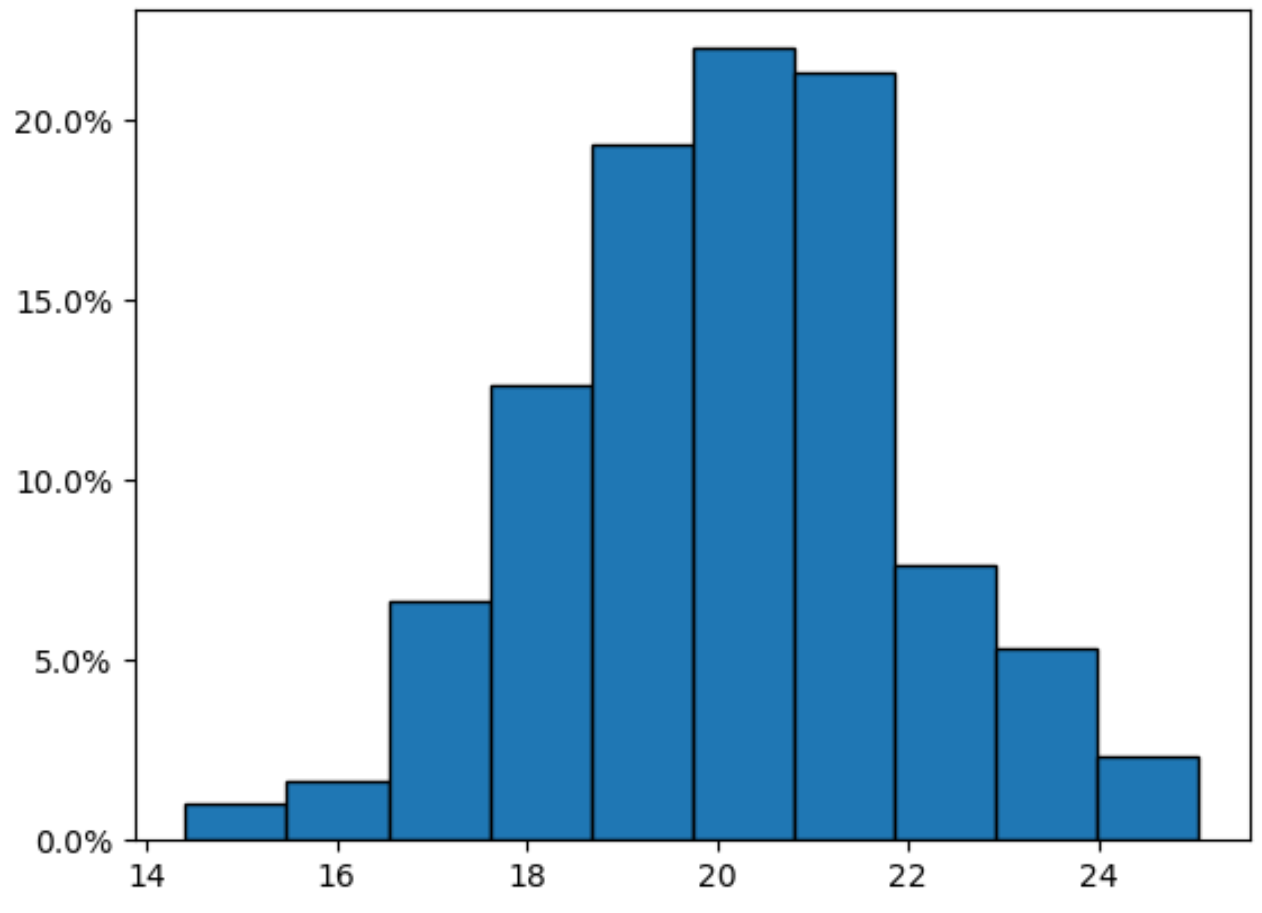
โปรดทราบว่าขณะนี้แกน Y จะแสดงเปอร์เซ็นต์
หากคุณต้องการลบตำแหน่งทศนิยมออกจากเปอร์เซ็นต์ เพียงใช้อาร์กิวเมนต์ decimals=0 ในฟังก์ชัน PercentFormatter() :
 import numpy as np
import matplotlib. pyplot as plt
from matplotlib. ticker import PercentFormatter

#create histogram, using percentages instead of counts
plt. hist (df[' points '], weights=np. ones ( len (df)) / len (df), edgecolor=' black ')

#apply percentage format to y-axis
plt. gca (). yaxis . set_major_formatter (PercentFormatter(1, decimals= 0 ))
plt. show ()
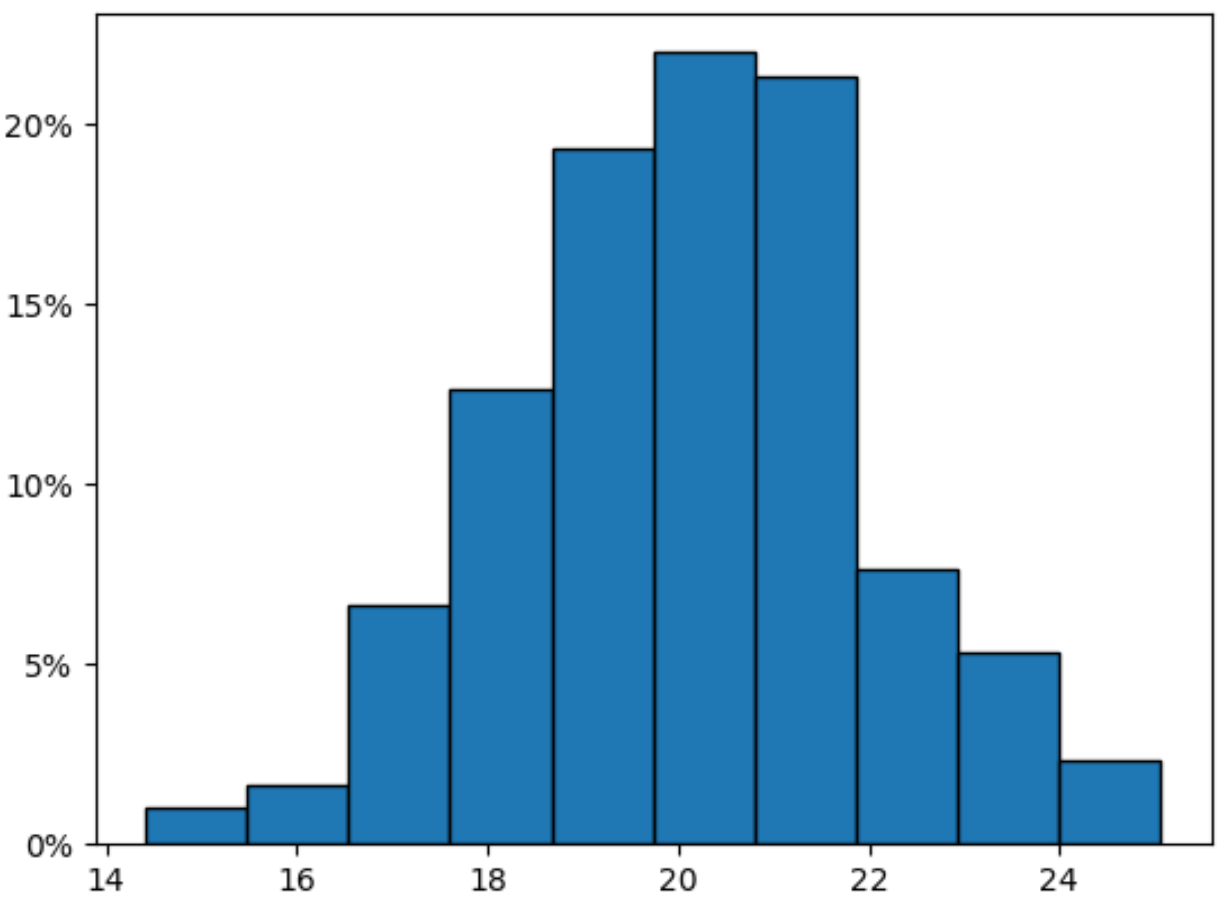
ขณะนี้แกน Y จะแสดงเปอร์เซ็นต์โดยไม่มีตำแหน่งทศนิยม
แหล่งข้อมูลเพิ่มเติม
บทช่วยสอนต่อไปนี้จะอธิบายวิธีการทำงานทั่วไปอื่นๆ ในแพนด้า:
วิธีเปลี่ยนจำนวนถังขยะที่ใช้ในฮิสโตแกรมของ Pandas
วิธีเปลี่ยนช่วงของแกน X ในฮิสโตแกรมของ Pandas
วิธีการพล็อตฮิสโตแกรมตามกลุ่มใน Pandas
เกี่ยวกับผู้แต่ง
ดร.เบนจามิน แอนเดอร์สัน
สวัสดี ฉันชื่อเบนจามิน ศาสตราจารย์สถิติเกษียณอายุแล้ว และผันตัวมาเป็นครูสอนสถิติโดยเฉพาะ ด้วยประสบการณ์และความเชี่ยวชาญที่กว้างขวางในสาขาสถิติ ฉันกระตือรือร้นที่จะแบ่งปันความรู้ของฉันเพื่อเสริมศักยภาพนักเรียนผ่าน Statorials. รู้เพิ่มเติม