วิธีพล็อตสองคอลัมน์จาก pandas dataframe
มีสองวิธีทั่วไปในการวางแผนค่าของสองคอลัมน์ใน DataFrame ของ pandas:
วิธีที่ 1: พล็อตสองคอลัมน์เป็นจุดบน Scatterplot
 import matplotlib. pyplot as plt

plt. scatter (df[' column1 '], df[' column2 '])
วิธีที่ 2: พล็อตสองคอลัมน์เป็นเส้นบนกราฟเส้น
df. plot (x=' column1 ',y=[' column2 ',' column3 '])
ตัวอย่างต่อไปนี้แสดงวิธีการใช้แต่ละวิธีในทางปฏิบัติ
ตัวอย่างที่ 1: พล็อตสองคอลัมน์บน Scatterplot
สมมติว่าเรามี DataFrame แพนด้าต่อไปนี้ซึ่งมีข้อมูลเกี่ยวกับผู้เล่นบาสเกตบอลต่างๆ:
 import pandas as pd

#createDataFrame
df = pd. DataFrame ({' team ': ['A', 'B', 'C', 'D', 'E', 'F', 'G', 'H'],
                   ' points ': [18, 22, 19, 14, 14, 11, 20, 28],
                   ' assists ': [5, 7, 7, 9, 12, 9, 9, 4]})

#view DataFrame
print (df)

  team points assists
0 to 18 5
1 B 22 7
2 C 19 7
3 D 14 9
4 E 14 12
5 F 11 9
6 G 20 9
7:28 a.m. 4
เราสามารถใช้โค้ดต่อไปนี้เพื่อสร้าง Scatterplot ที่แสดงคอลัมน์ จุด บนแกน x และคอลัมน์ ช่วยเหลือ บนแกน y:
 import matplotlib. pyplot as plt

#create scatterplot
plt. scatter (df[' points '], df[' assists '])

#add axis labels
plt. xlabel (' Points ')
plt. ylabel (' Assists ')
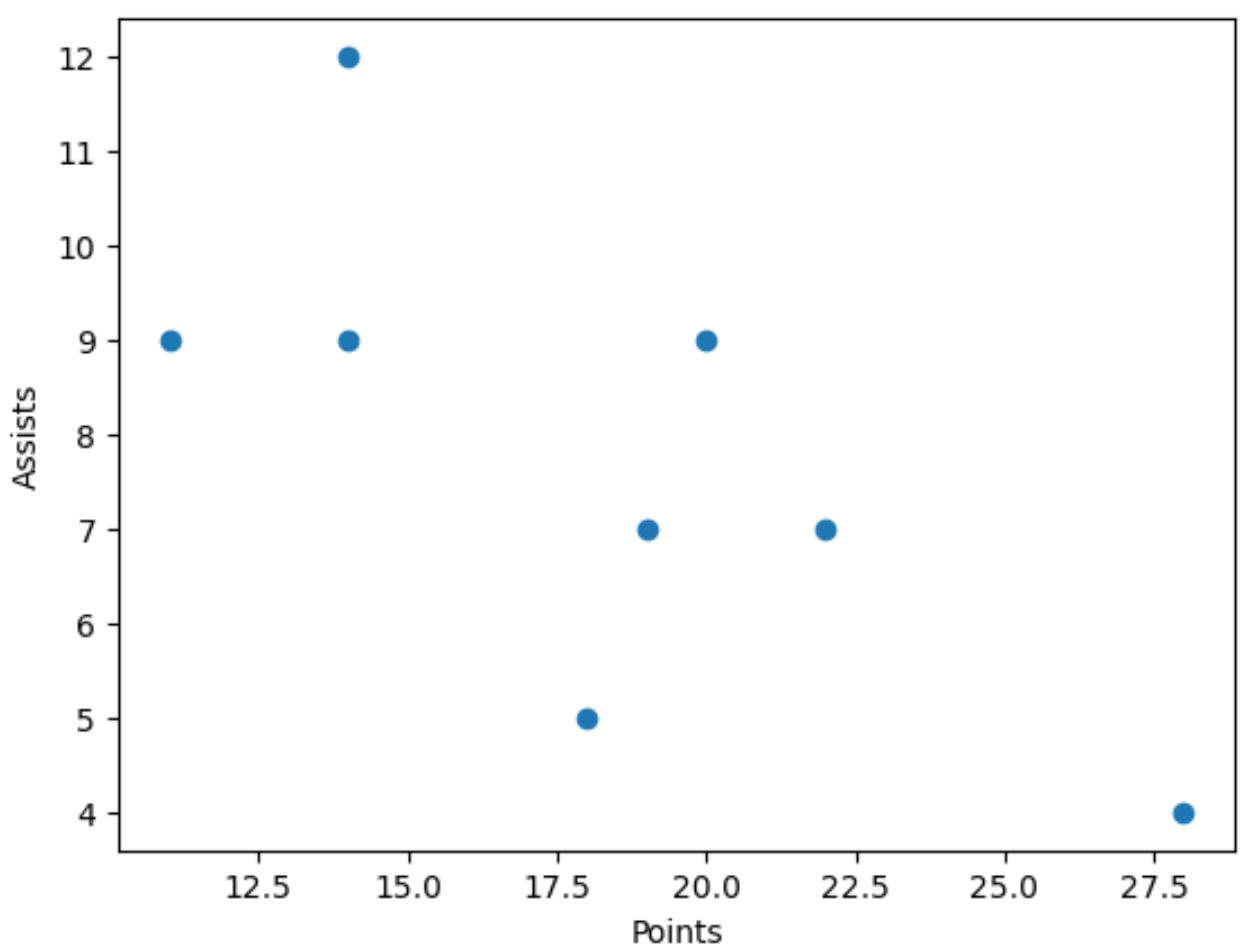
แกน X มีค่าจากคอลัมน์ จุด และแกน Y มีค่าจากคอลัมน์ ช่วยเหลือ
ตัวอย่างที่ 2: พล็อตสองคอลัมน์บนกราฟเส้น
สมมติว่าเรามี DataFrame แพนด้าต่อไปนี้ซึ่งมีข้อมูลเกี่ยวกับคะแนนที่ทำได้และคะแนนที่ทีมบาสเก็ตบอลอนุญาตในหกเกมที่แตกต่างกัน:
 import pandas as pd

#createDataFrame
df = pd. DataFrame ({' game ': [1, 2, 3, 4, 5, 6],
                   ' points_for ': [99, 94, 92, 90, 87, 85],
                   ' points_against ': [89, 76, 78, 78, 85, 87]})

#view DataFrame
print (df)

   game points_for points_against
0 1 99 89
1 2 94 76
2 3 92 78
3 4 90 78
4 5 87 85
5 6 85 87
เราสามารถใช้โค้ดต่อไปนี้เพื่อสร้างแผนภูมิเส้นที่แสดงค่าของ point_for บนบรรทัดหนึ่งและ point_against บนอีกบรรทัดหนึ่งในขณะที่ใช้ค่าของ เกม บนแกน x:
 #plot points_for and points_against columns on same y-axis
df. plot (x=' game ', y=[' points_for ', ' points_against '])
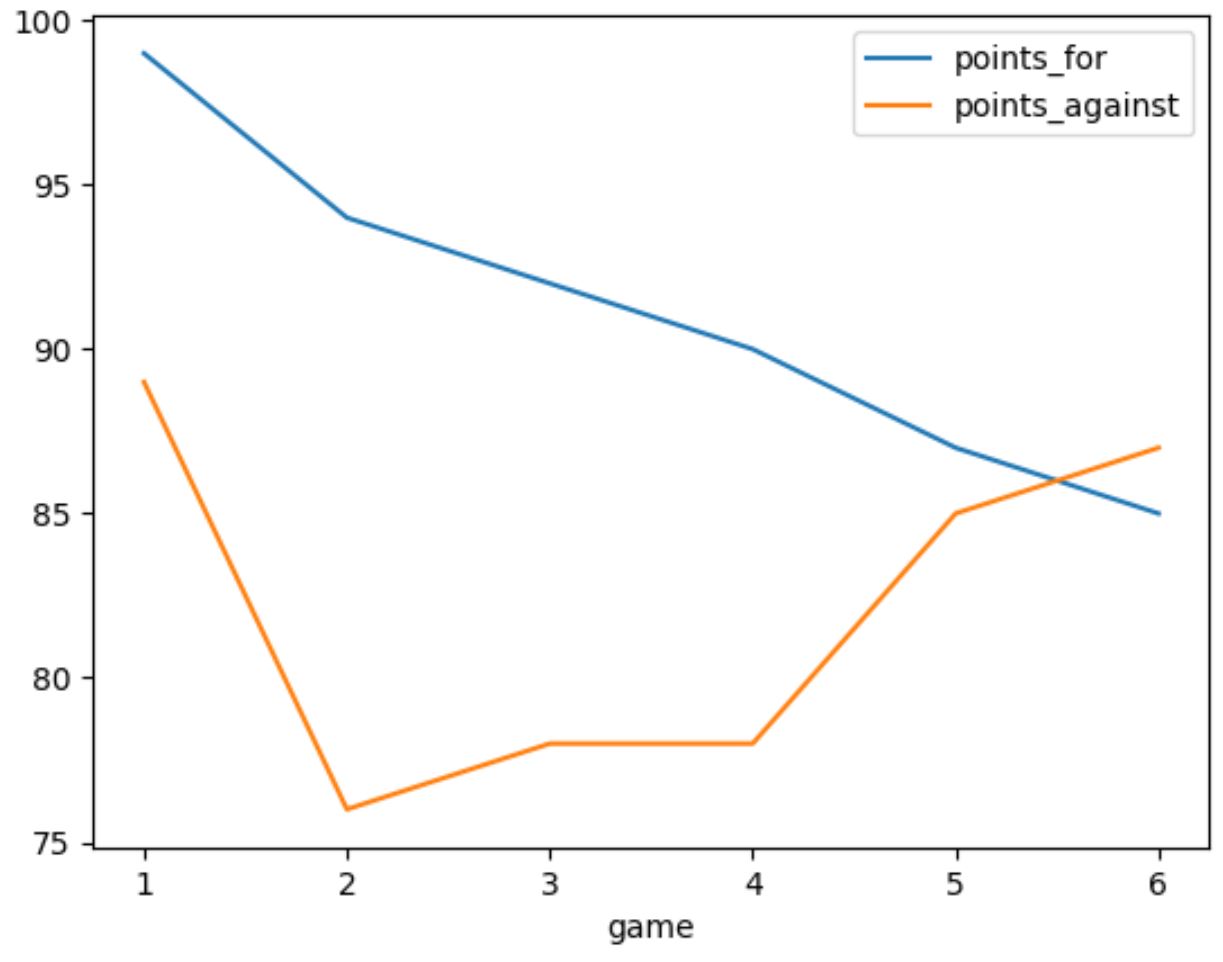
เส้นสีน้ำเงินแสดงถึงค่าคอลัมน์ point_for ในแต่ละเกม และเส้นสีส้มแสดงถึงค่าคอลัมน์ point_for ในแต่ละเกม
แหล่งข้อมูลเพิ่มเติม
บทช่วยสอนต่อไปนี้จะอธิบายวิธีการทำงานทั่วไปอื่นๆ ในแพนด้า:
วิธีใช้ Groupby และ Plot ใน Pandas
วิธีการพล็อตการกระจายค่าคอลัมน์ใน Pandas
วิธีปรับขนาดรูปของพล็อตแพนด้า
เกี่ยวกับผู้แต่ง
ดร.เบนจามิน แอนเดอร์สัน
สวัสดี ฉันชื่อเบนจามิน ศาสตราจารย์สถิติเกษียณอายุแล้ว และผันตัวมาเป็นครูสอนสถิติโดยเฉพาะ ด้วยประสบการณ์และความเชี่ยวชาญที่กว้างขวางในสาขาสถิติ ฉันกระตือรือร้นที่จะแบ่งปันความรู้ของฉันเพื่อเสริมศักยภาพนักเรียนผ่าน Statorials. รู้เพิ่มเติม