วิธีปรับความหนาของเส้นใน ggplot2
คุณสามารถใช้อาร์กิวเมนต์ ขนาด เพื่อปรับความหนาของเส้นใน ggplot2 :
 ggplot(df, aes (x = x, y = y)) +
  geom_line(size = 1.5 )
ขนาดเริ่มต้นที่ 1 แต่คุณสามารถระบุค่าทศนิยมใดๆ ที่คุณต้องการปรับความหนาได้
บทช่วยสอนนี้ให้ตัวอย่างวิธีปรับน้ำหนักเส้นในทางปฏิบัติ
ตัวอย่าง: ปรับความหนาของเส้นใน ggplot2
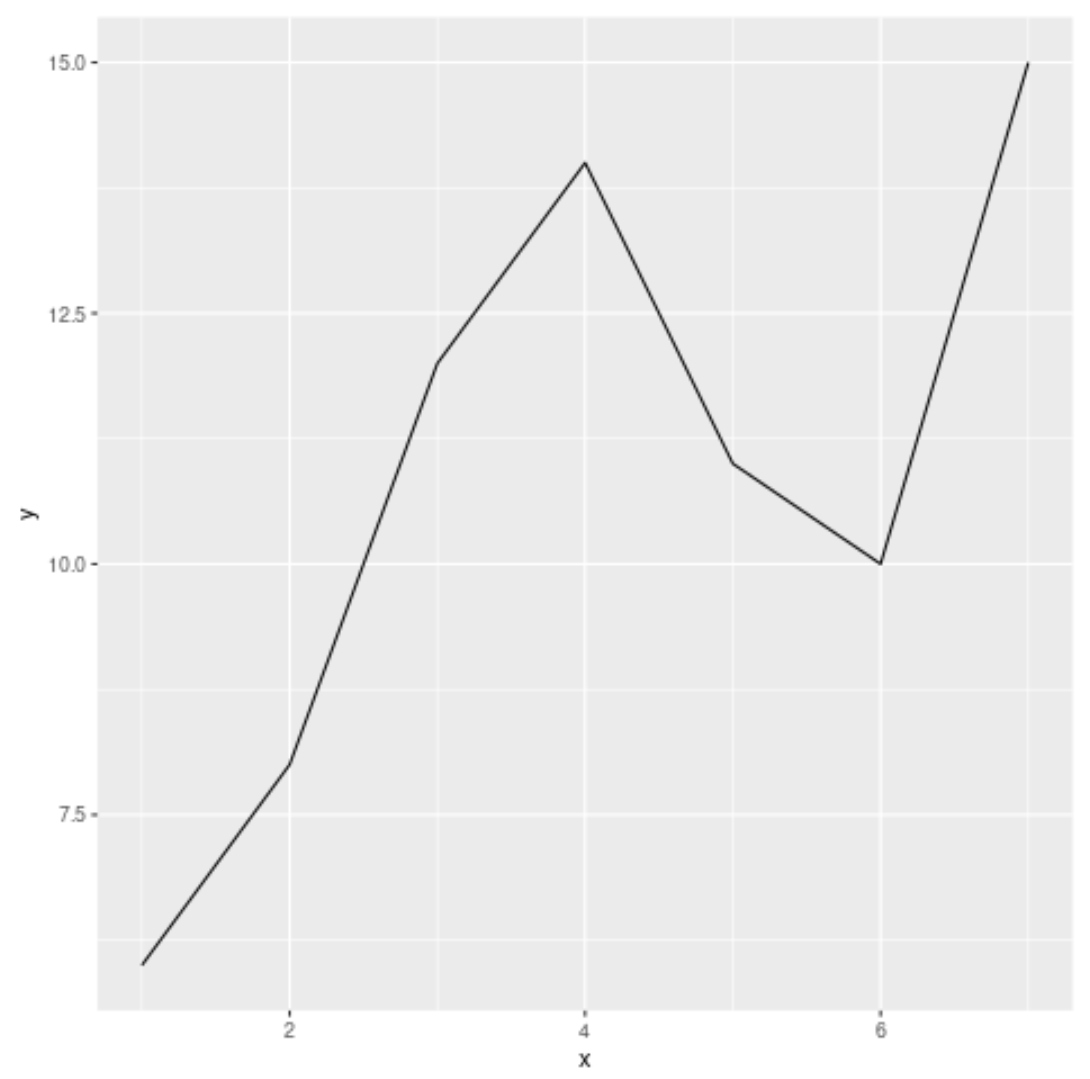
รหัสต่อไปนี้แสดงวิธีสร้างการลงจุดเส้นอย่างง่ายโดยใช้ ggplot2:
 #load ggplot2 visualization package
library (ggplot2)

#create data
df <- data. frame (x=c(1, 2, 3, 4, 5, 6, 7),
                 y=c(6, 8, 12, 14, 11, 10, 15))

#create line plot
ggplot(df, aes (x = x, y = y)) +
  geom_line()

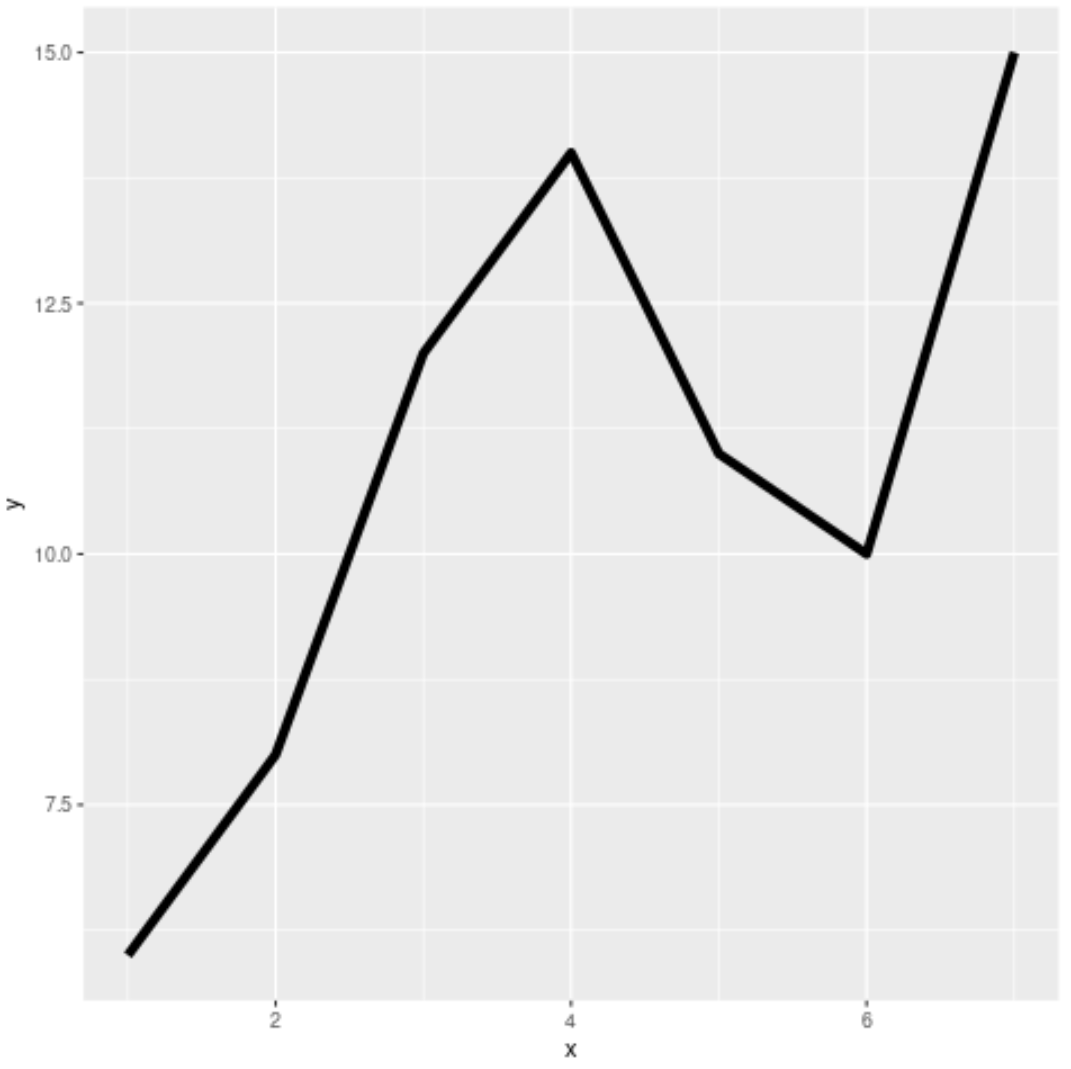
ตามค่าเริ่มต้น ความหนาของเส้นจะเท่ากับ 1 แต่สามารถเพิ่มได้โดยใช้อาร์กิวเมนต์ ขนาด :
 library (ggplot2)

#create line plot
ggplot(df, aes (x = x, y = y)) +
  geom_line(size = 2 )

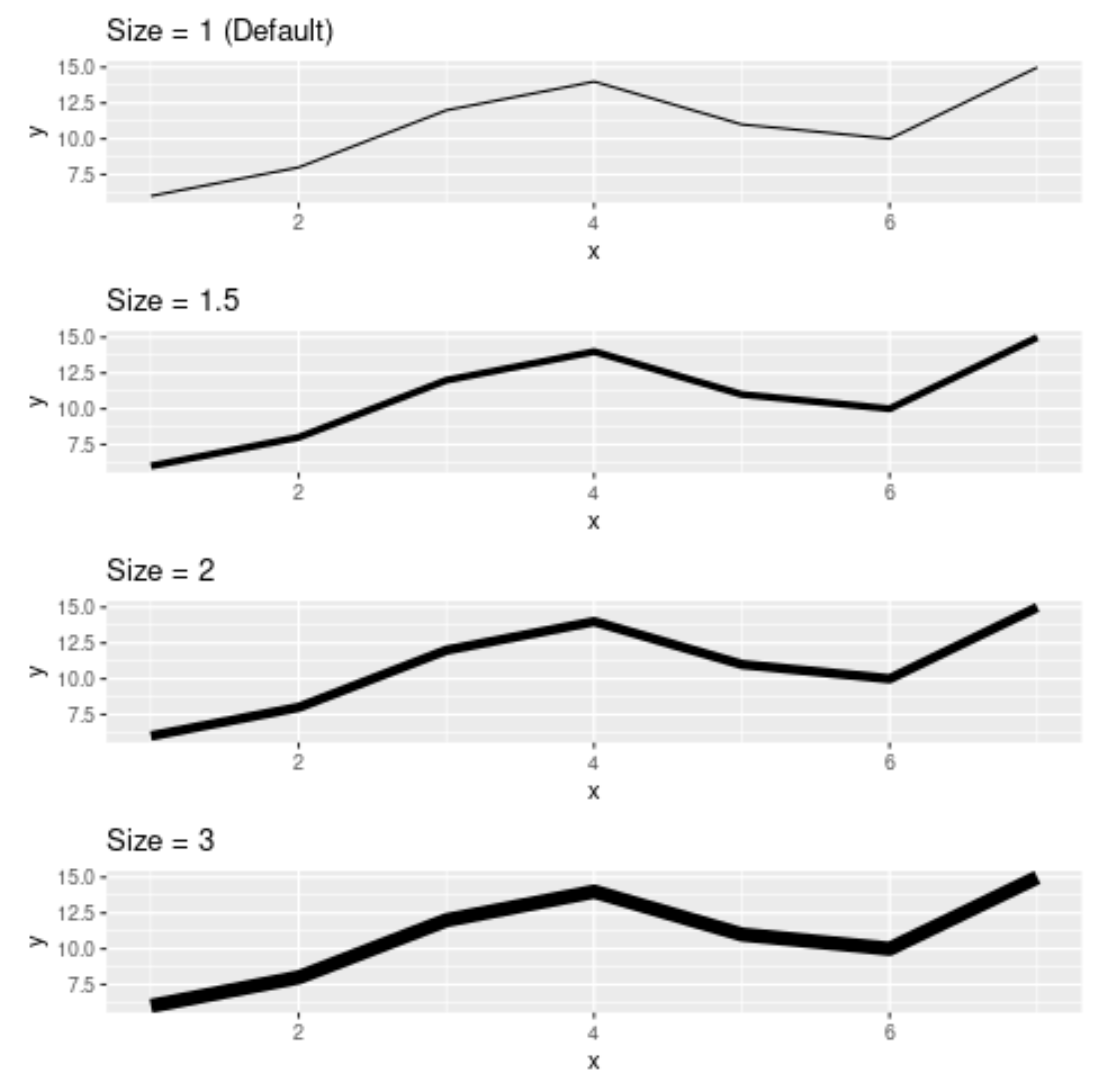
รหัสต่อไปนี้แสดงเส้นแปลงที่แตกต่างกันโดยใช้ขนาดที่แตกต่างกันสำหรับน้ำหนักเส้น:
 library (ggplot2)
library (gridExtra)

#create data
df <- data. frame (x=c(1, 2, 3, 4, 5, 6, 7),
                 y=c(6, 8, 12, 14, 11, 10, 15))

#create four line plots
plot1 <- ggplot(df, aes (x=x,y=y)) + geom_line() + ggtitle(" Size = 1 (Default) ")
plot2 <- ggplot(df, aes (x=x,y=y)) + geom_line(size= 1.5 ) + ggtitle(" Size = 1.5 ")
plot3 <- ggplot(df, aes (x=x,y=y)) + geom_line(size= 2 ) + ggtitle(" Size = 2 ")
plot4 <- ggplot(df, aes (x=x,y=y)) + geom_line(size= 3 ) + ggtitle(" Size = 3 ")

#display all line plots stacked on top of each other
grid. arrange (plot1, plot2, plot3, plot4, ncol=1)

ยิ่งค่าที่กำหนดให้กับอาร์กิวเมนต์ ขนาด มากขึ้น เส้นก็จะหนาขึ้นในพล็อต
ค้นหาบทช่วยสอน R เพิ่มเติม ที่นี่