วิธีเรียงลำดับ boxplot บนแกน x ใน seaborn
คุณสามารถใช้วิธีการต่อไปนี้เพื่อเปลี่ยนลำดับของ boxplots ตามแกน x ใน Seaborn:
วิธีที่ 1: จัดเรียงกล่องแปลงโดยใช้คำสั่งที่กำหนดเอง
sns. boxplot (x=' group_var ', y=' values_var ', data=df, order=[' A ',' B ',' C '])
วิธีที่ 2: จัดเรียงแผนผังกล่องโดยใช้เมตริก
 group_means=df. groupby ([' group_var '])[' values_var ']. mean (). sort_values (ascending= True )

sns. boxplot (x=' group_var ', y=' values_var ', data=df, order=group_means. index )
ตัวอย่างต่อไปนี้แสดงวิธีการใช้แต่ละวิธีในทางปฏิบัติกับ DataFrame ของแพนด้าต่อไปนี้ ซึ่งแสดงคะแนนที่ผู้เล่นบาสเก็ตบอลจากสามทีมทำคะแนนได้:
 import pandas as pd

#createDataFrame
df = pd. DataFrame ({' team ': ['A', 'A', 'A', 'A', 'A', 'B', 'B', 'B',
                            'B', 'B', 'C', 'C', 'C', 'C', 'C'],
                   ' points ': [3, 4, 6, 8, 9, 10, 13, 16, 18, 20, 8, 9, 12, 13, 15]})

#view head of DataFrame
print ( df.head ())

  team points
0 to 3
1 to 4
2 to 6
3 to 8
4 to 9
ตัวอย่างที่ 1: พล็อตกล่องคำสั่งซื้อโดยใช้คำสั่งซื้อที่กำหนดเอง
รหัสต่อไปนี้แสดงวิธีสร้าง Boxplot เพื่อแสดงภาพการกระจายคะแนนสำหรับแต่ละทีม และจัดอันดับ Boxplots ตามลำดับต่อไปนี้ตามชื่อทีม: C, A, B
 import seaborn as sns

#create boxplots with custom order
sns. boxplot (x=' team ', y=' points ', data=df, order=[' C ', ' A ', ' B '])
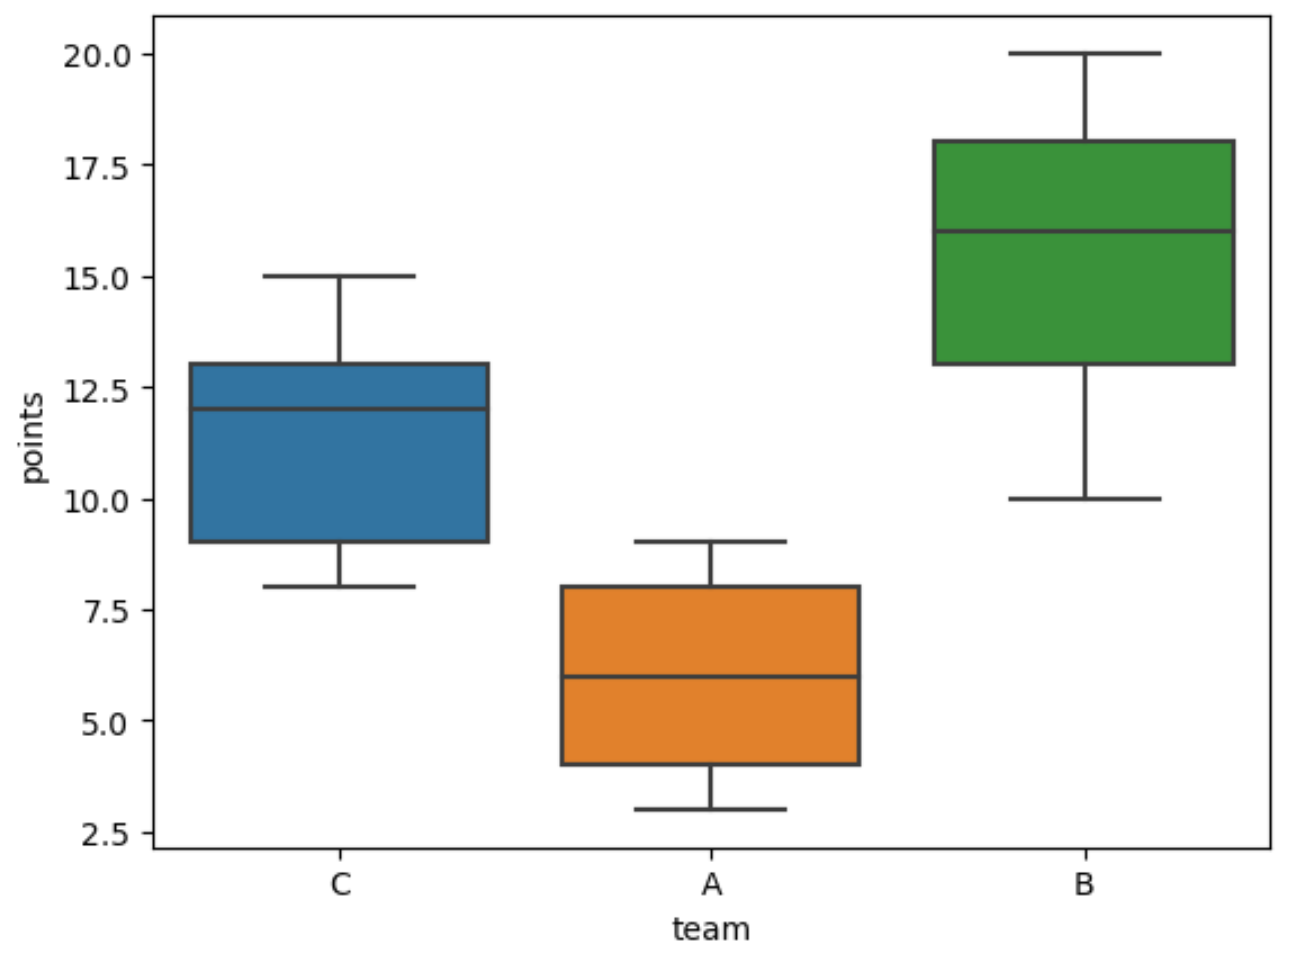
โปรดทราบว่า Boxplot จะเรียงลำดับตามแกน X ตามลำดับที่เราระบุไว้
ตัวอย่างที่ 2: การสั่งซื้อแปลงกล่องโดยใช้เมตริก
รหัสต่อไปนี้แสดงวิธีการสร้าง Boxplot เพื่อแสดงภาพการกระจายคะแนนสำหรับแต่ละทีม และจัดอันดับ Boxplots ตามลำดับจากน้อยไปหามากโดยพิจารณาจากคะแนนเฉลี่ยที่ทำได้ต่อทีม:
 import seaborn as sns

#calculate mean points by team
mean_by_team = df. groupby ([' team '])[' points ']. mean (). sort_values (ascending= True )

#create boxplots ordered by mean points (ascending)
sns. boxplot (x=' team ', y=' points ', data=df, order=mean_by_team. index )
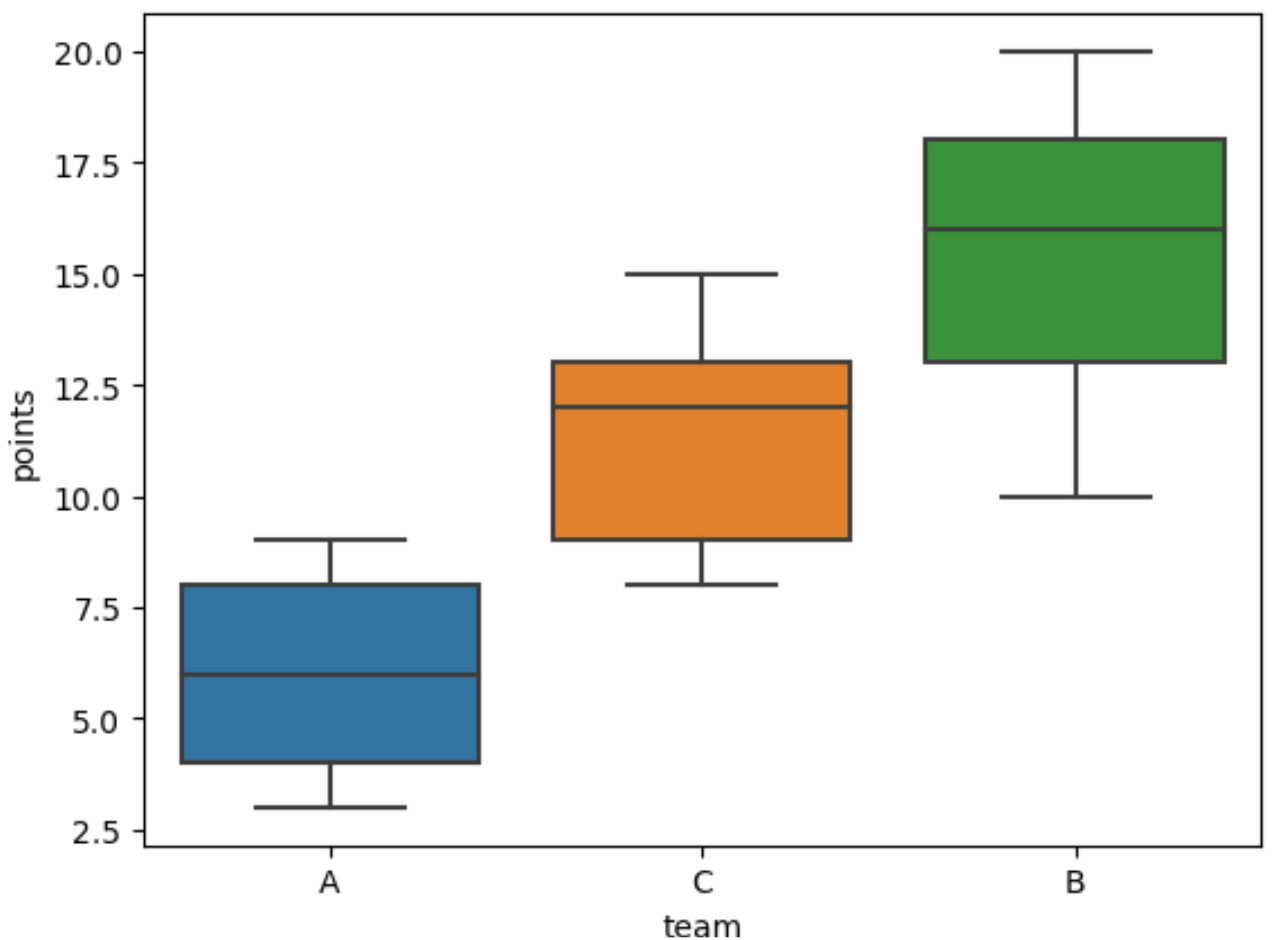
โปรดทราบว่า Boxplots จะเรียงลำดับตามแกน X ตามค่าคะแนนเฉลี่ยต่อทีมโดยเรียงลำดับจากน้อยไปหามาก
หากต้องการแสดง boxplots ตามลำดับจากมากไปน้อย เพียงระบุ ascending=False ในฟังก์ชัน sort_values() :
 import seaborn as sns

#calculate mean points by team
mean_by_team = df. groupby ([' team '])[' points ']. mean (). sort_values (ascending= False )

#create boxplots ordered by mean points (descending)
sns. boxplot (x=' team ', y=' points ', data=df, order=mean_by_team. index )
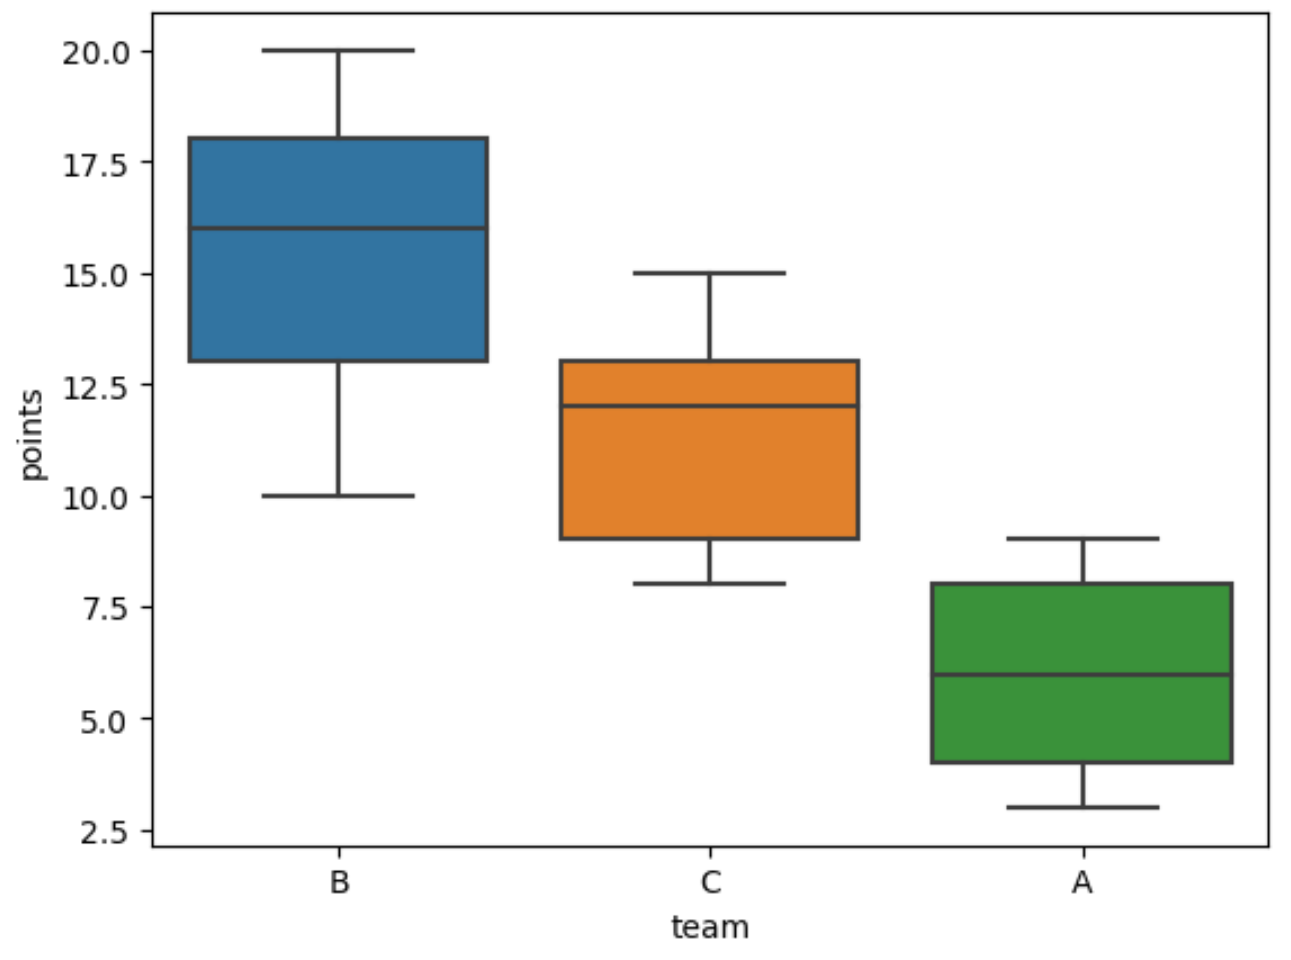
ขณะนี้ Boxplots ได้รับการจัดลำดับตามแกน x ตามค่าคะแนนเฉลี่ยต่อทีมจากมากไปน้อย
หมายเหตุ : หากต้องการจัดเรียง boxplots ตามเมตริกอื่น (เช่น ค่ามัธยฐาน) เพียงระบุเมตริกนั้นหลังฟังก์ชัน groupby() ในโค้ดด้านบน
แหล่งข้อมูลเพิ่มเติม
บทช่วยสอนต่อไปนี้จะอธิบายวิธีการทำหน้าที่ทั่วไปอื่นๆ ในทะเล:
วิธีลบค่าผิดปกติออกจากบ็อกซ์พล็อตของ Seaborn
วิธีสร้าง Boxplot แบบหลายคอลัมน์ใน Seaborn
เกี่ยวกับผู้แต่ง
ดร.เบนจามิน แอนเดอร์สัน
สวัสดี ฉันชื่อเบนจามิน ศาสตราจารย์สถิติเกษียณอายุแล้ว และผันตัวมาเป็นครูสอนสถิติโดยเฉพาะ ด้วยประสบการณ์และความเชี่ยวชาญที่กว้างขวางในสาขาสถิติ ฉันกระตือรือร้นที่จะแบ่งปันความรู้ของฉันเพื่อเสริมศักยภาพนักเรียนผ่าน Statorials. รู้เพิ่มเติม