วิธีเปลี่ยนตำแหน่งคำอธิบายใน ggplot2 (พร้อมตัวอย่าง)
คุณสามารถใช้ไวยากรณ์ต่อไปนี้เพื่อระบุตำแหน่งของคำอธิบาย ggplot2:
theme(legend.position = " right ")
ตัวอย่างต่อไปนี้แสดงวิธีใช้ไวยากรณ์นี้ในทางปฏิบัติกับชุดข้อมูล ม่านตา ในตัวใน R
ตัวอย่าง: วางคำอธิบายไว้นอกโครงเรื่อง
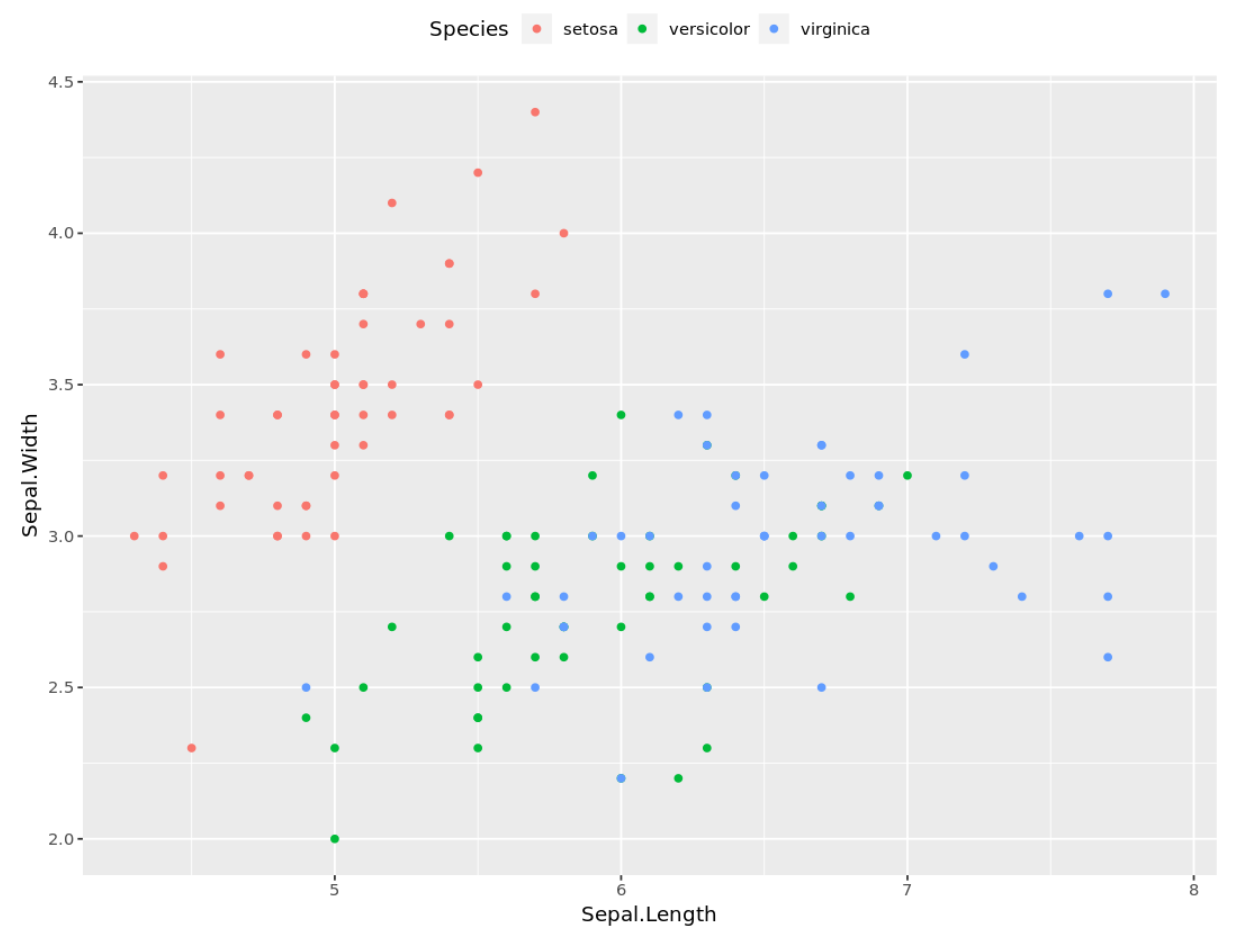
คุณสามารถบอก ggplot2 ได้โดยตรงให้วางคำอธิบายไว้ที่ด้าน “บน”, “ขวา”, “ล่าง” หรือ “ซ้าย” ของโครงเรื่อง
ตัวอย่างเช่น ต่อไปนี้คือวิธีวางคำอธิบายไว้ที่ด้านบนสุดของโครงเรื่อง:
 library (ggplot2)

ggplot(iris, aes (x=Sepal.Length, y=Sepal.Width, color=Species)) +
       geom_point() +
       theme(legend.position = “ top ”)
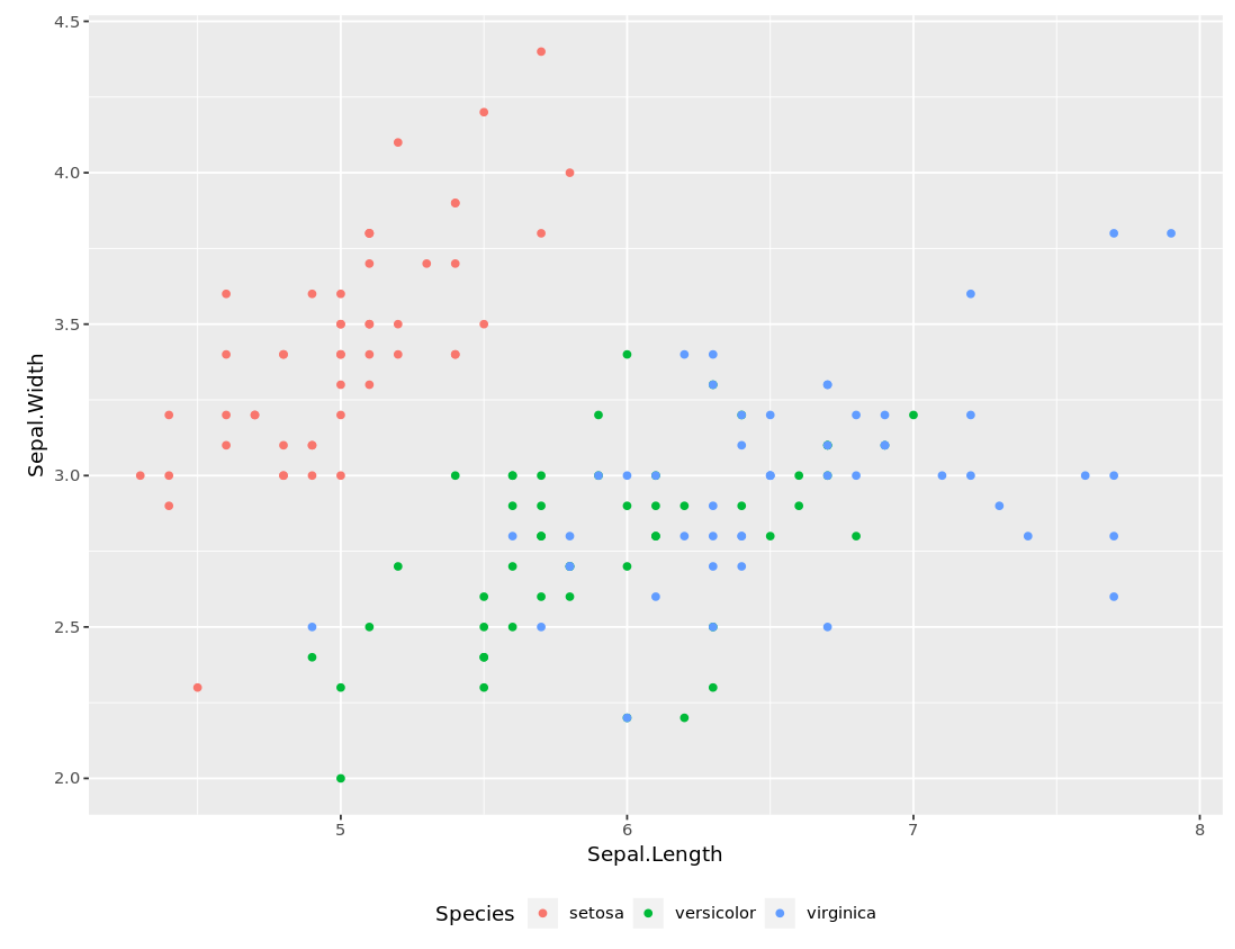
และนี่คือวิธีวางคำอธิบายไว้ที่ด้านล่างของโครงเรื่อง:
 library (ggplot2)

ggplot(iris, aes (x=Sepal.Length, y=Sepal.Width, color=Species)) +
       geom_point() +
       theme(legend.position = “ bottom ”)
ตัวอย่าง: วางคำอธิบายไว้ในโครงเรื่อง
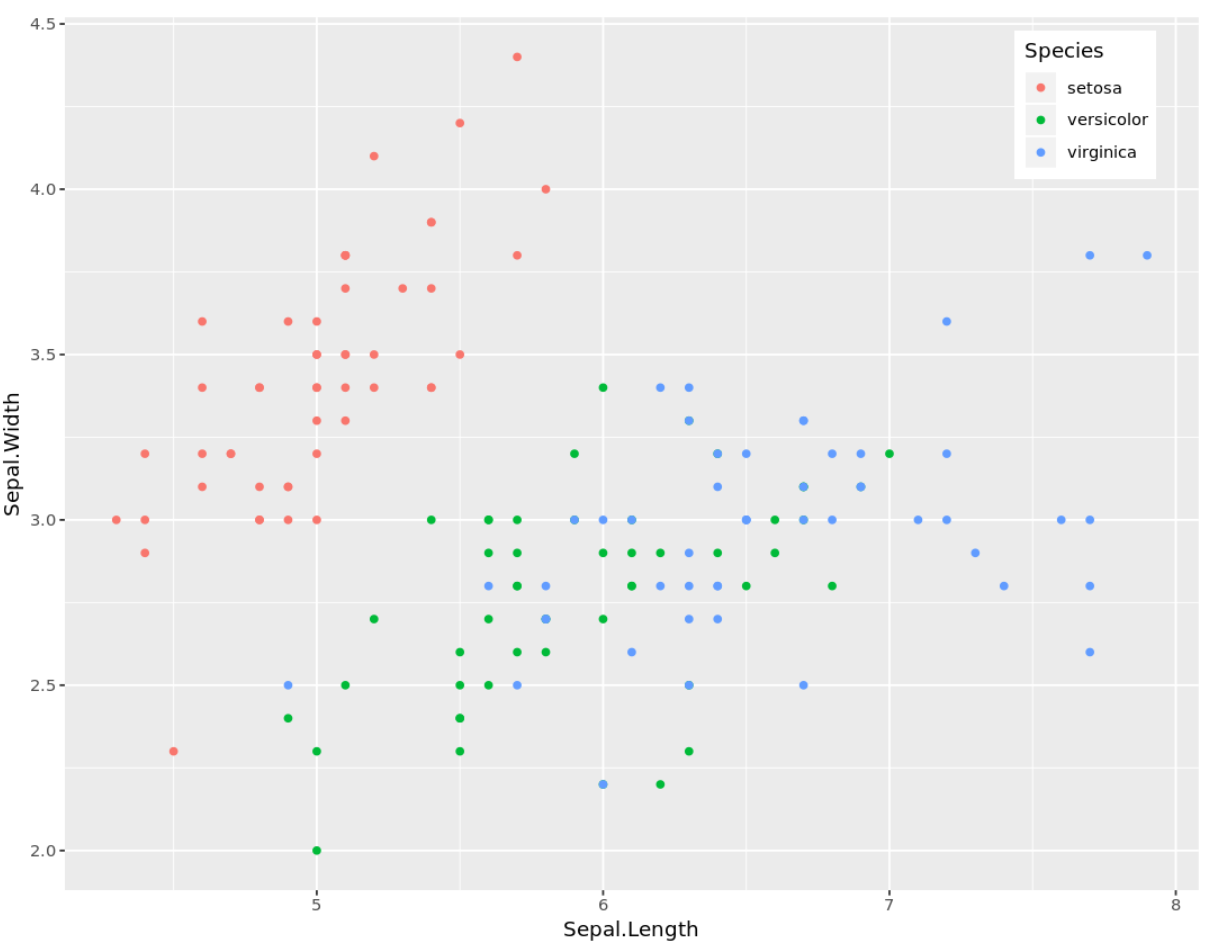
คุณยังสามารถระบุพิกัดที่แน่นอน (x,y) เพื่อวางคำอธิบายไว้ภายในพล็อตได้
ตัวอย่างเช่น ต่อไปนี้เป็นวิธีวางคำบรรยายที่มุมขวาบน:
 library (ggplot2)

ggplot(iris, aes (x=Sepal.Length, y=Sepal.Width, color=Species)) +
       geom_point() +
       theme(legend.position = c( .9 , .9 ))
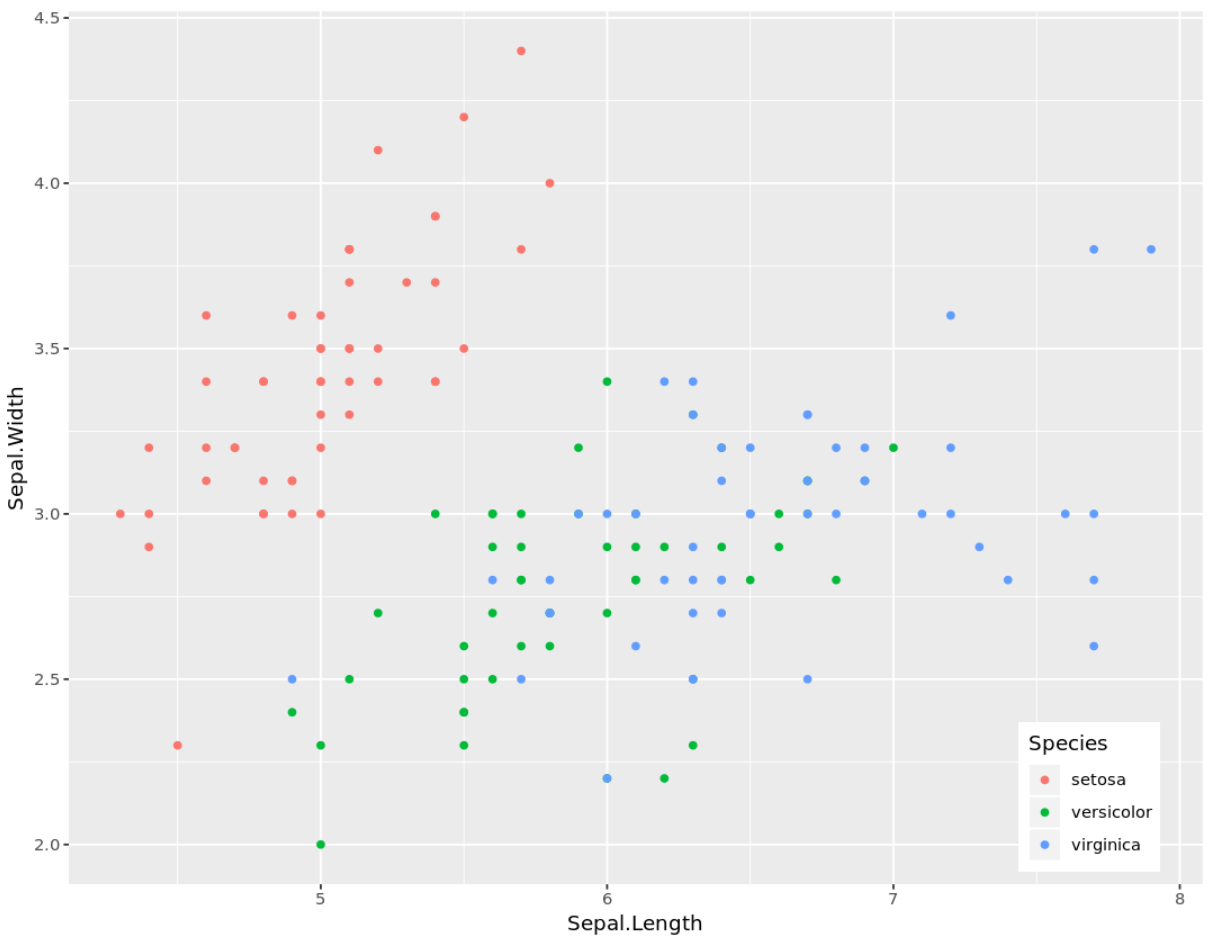
และวิธีการวางคำอธิบายไว้ที่มุมขวาล่าง:
 library (ggplot2)

ggplot(iris, aes (x=Sepal.Length, y=Sepal.Width, color=Species)) +
       geom_point() +
       theme(legend.position = c( .9 , .1 ))
ตัวอย่าง: ลบคำอธิบายแผนภูมิออกทั้งหมด
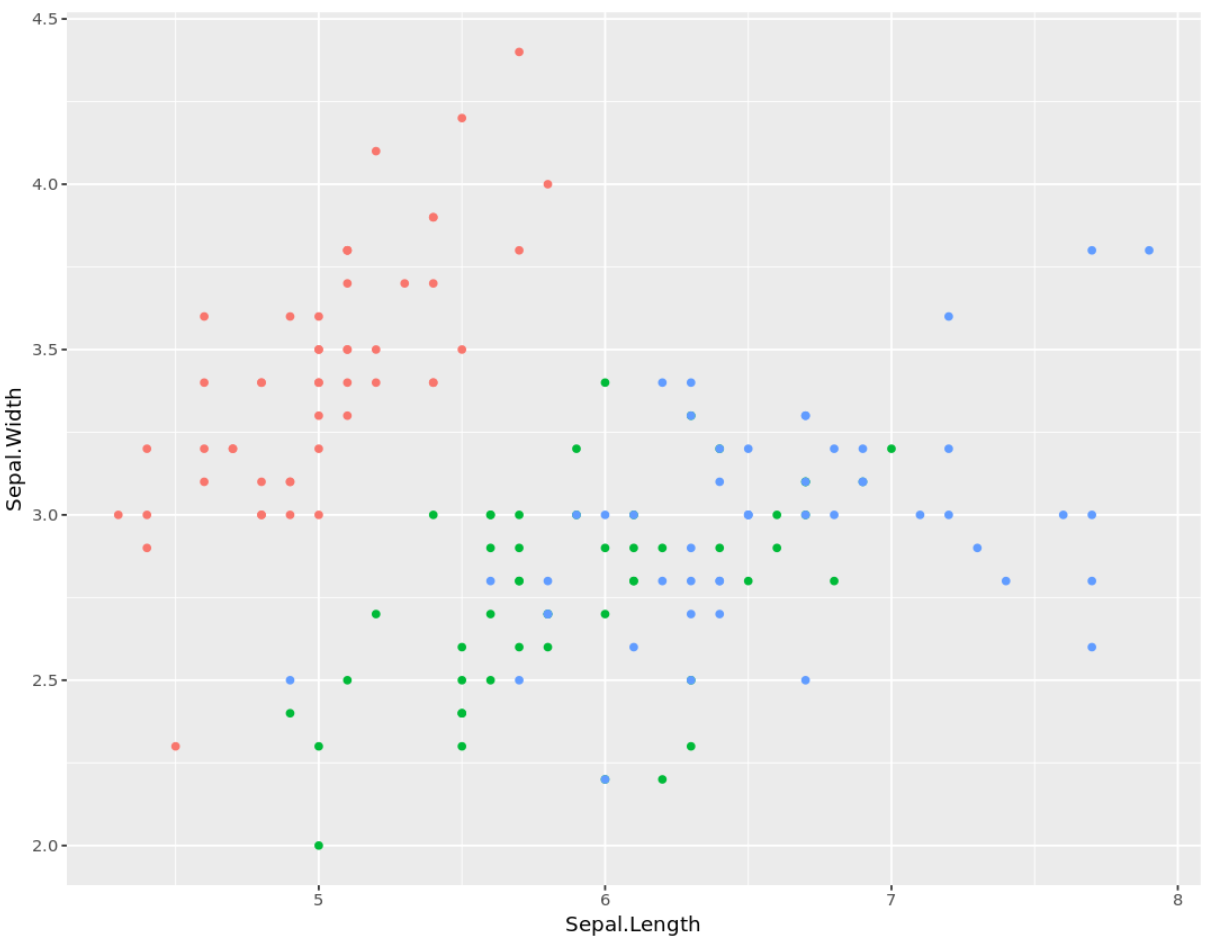
คุณยังสามารถลบคำอธิบายแผนภูมิออกจากโครงเรื่องทั้งหมดใน ggplot2 ได้โดยระบุ legend.position=”none” ดังนี้:
 library (ggplot2)

ggplot(iris, aes (x=Sepal.Length, y=Sepal.Width, color=Species)) +
       geom_point() +
       theme(legend.position = " none ")
แหล่งข้อมูลเพิ่มเติม
วิธีเปลี่ยนขนาดคำอธิบายแผนภูมิใน ggplot2
วิธีเปลี่ยนชื่อคำอธิบายใน ggplot2
คู่มือฉบับสมบูรณ์เกี่ยวกับธีม ggplot2 ที่ดีที่สุด