วิธีแสดงเปอร์เซ็นต์ของฮิสโตแกรมใน ggplot2
คุณสามารถใช้ไวยากรณ์พื้นฐานต่อไปนี้เพื่อแสดงเปอร์เซ็นต์บนแกน y ของฮิสโตแกรมใน ggplot2:
 library (ggplot2)
library (scales)

#create histogram with percentages
ggplot(data, aes (x = factor (team))) +
  geom_bar( aes (y = (..count..)/ sum (..count..))) +
  scale_y_continuous(labels=percent)
ตัวอย่างต่อไปนี้แสดงวิธีใช้ไวยากรณ์นี้ในทางปฏิบัติ
ตัวอย่างที่ 1: ฮิสโตแกรมพื้นฐานพร้อมเปอร์เซ็นต์
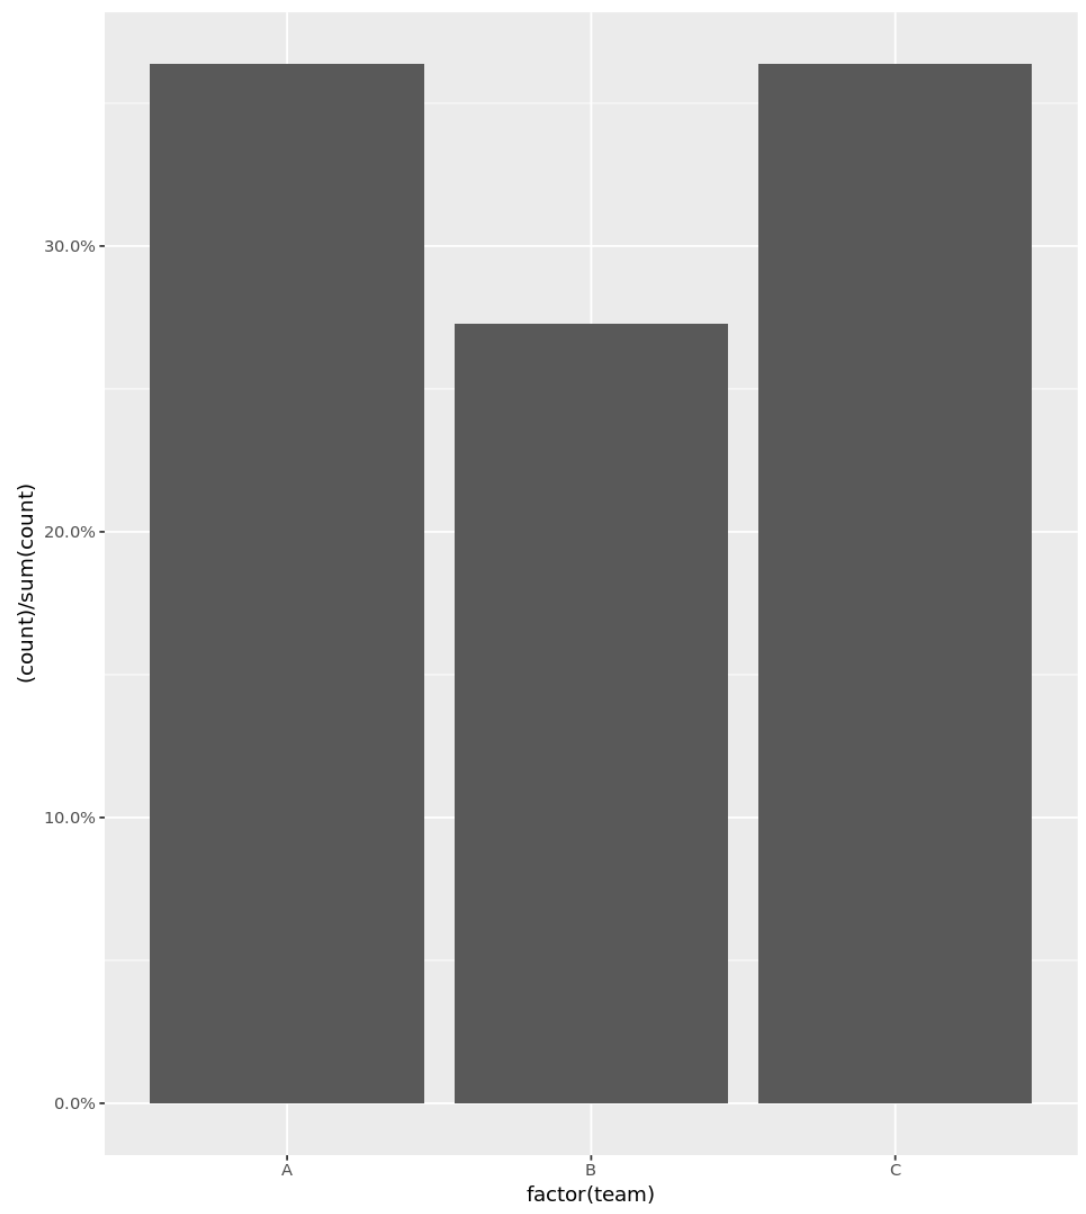
รหัสต่อไปนี้แสดงวิธีการสร้างฮิสโตแกรมสำหรับตัวแปรหมวดหมู่พร้อมเปอร์เซ็นต์ที่แสดงบนแกน Y:
 library (ggplot2)
library (scales)

#define data frame
data <- data. frame (team = c('A', 'A', 'A', 'A', 'B', 'B', 'B', 'C', 'C', 'C', 'C') ,
                   points = c(77, 79, 93, 85, 89, 99, 90, 80, 68, 91, 92))

#create histogram with percentages
ggplot(data, aes (x = factor (team))) +
  geom_bar( aes (y = (..count..)/ sum (..count..))) +
  scale_y_continuous(labels=percent)

ตัวอย่างที่ 2: ฮิสโตแกรมพร้อมเปอร์เซ็นต์ (ลบทศนิยม)
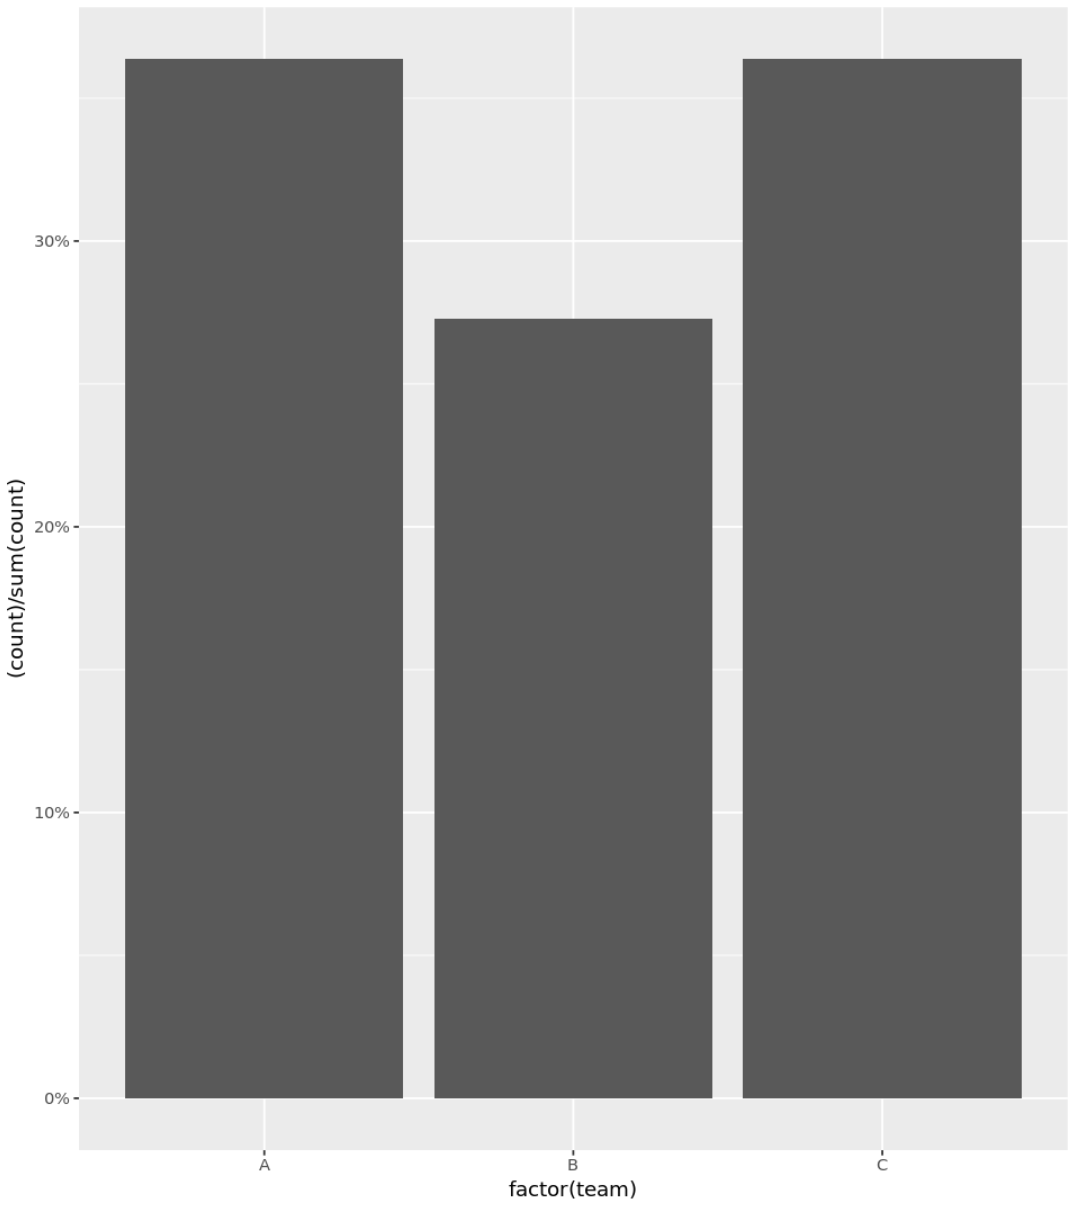
คุณยังสามารถใช้อาร์กิวเมนต์ ความแม่นยำ เพื่อแสดงเฉพาะจำนวนเต็มเป็นเปอร์เซ็นต์บนแกน y ได้:
 library (ggplot2)
library (scales)

#define data frame
data <- data. frame (team = c('A', 'A', 'A', 'A', 'B', 'B', 'B', 'C', 'C', 'C', 'C') ,
                   points = c(77, 79, 93, 85, 89, 99, 90, 80, 68, 91, 92))

#create histogram with percentages
ggplot(data, aes (x = factor (team))) +
  geom_bar( aes (y = (..count..)/ sum (..count..))) +
  scale_y_continuous(labels = scales :: percent_format(accuracy = 1L ))

ตัวอย่างที่ 3: ฮิสโตแกรมแบบกำหนดเองพร้อมเปอร์เซ็นต์
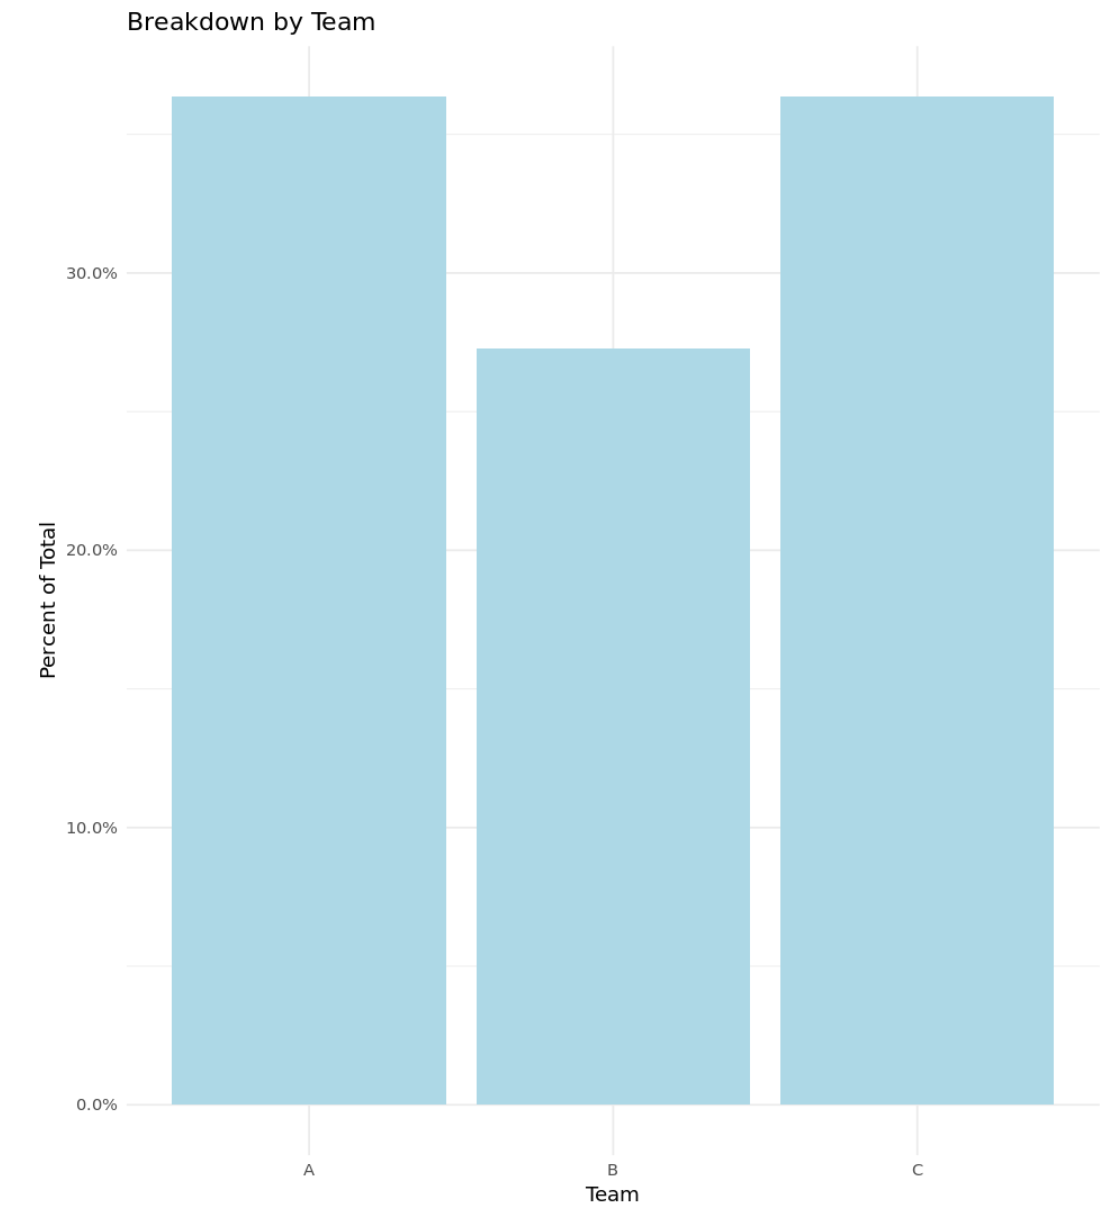
รหัสต่อไปนี้แสดงวิธีสร้างฮิสโตแกรมด้วยเปอร์เซ็นต์ที่แสดงบนแกน Y และชื่อที่กำหนดเอง ป้ายชื่อแกน และสี:
 library (ggplot2)
library (scales)

#define data frame
data <- data. frame (team = c('A', 'A', 'A', 'A', 'B', 'B', 'B', 'C', 'C', 'C', 'C') ,
                   points = c(77, 79, 93, 85, 89, 99, 90, 80, 68, 91, 92))

#create histogram with percentages and custom aesthetics
ggplot(data, aes (x = factor (team))) +
  geom_bar( aes (y = (..count..)/ sum (..count..)), fill = ' lightblue ') +
  scale_y_continuous(labels=percent) +
  labs(title = ' Breakdown by Team ', x = ' Team ', y = ' Percent of Total ') +
  theme_minimal()

ที่เกี่ยวข้อง: คู่มือฉบับสมบูรณ์สำหรับธีม ggplot2 ที่ดีที่สุด
แหล่งข้อมูลเพิ่มเติม
บทช่วยสอนต่อไปนี้จะอธิบายวิธีดำเนินการทั่วไปอื่นๆ ด้วยฮิสโตแกรมใน R:
วิธีเปลี่ยนจำนวนถังขยะในฮิสโตแกรมใน R
วิธีการพล็อตฮิสโตแกรมหลายอันใน R
วิธีสร้างฮิสโตแกรมความถี่สัมพัทธ์ใน R