วิธีรับขีดจำกัดแกนใน matplotlib (พร้อมตัวอย่าง)
คุณสามารถใช้ไวยากรณ์ต่อไปนี้เพื่อรับขีดจำกัดแกนสำหรับแกน x และ y ของพล็อตใน Matplotlib:
 import matplotlib. pyplot as plt

#get x-axis and y-axis limits
xmin, xmax, ymin, ymax = plt. axis ()

#print axis limits
print (xmin, xmax, ymin, ymax)
ตัวอย่างต่อไปนี้แสดงวิธีใช้ไวยากรณ์นี้ในทางปฏิบัติ
ตัวอย่าง: วิธีรับขีดจำกัดแกนใน Matplotlib
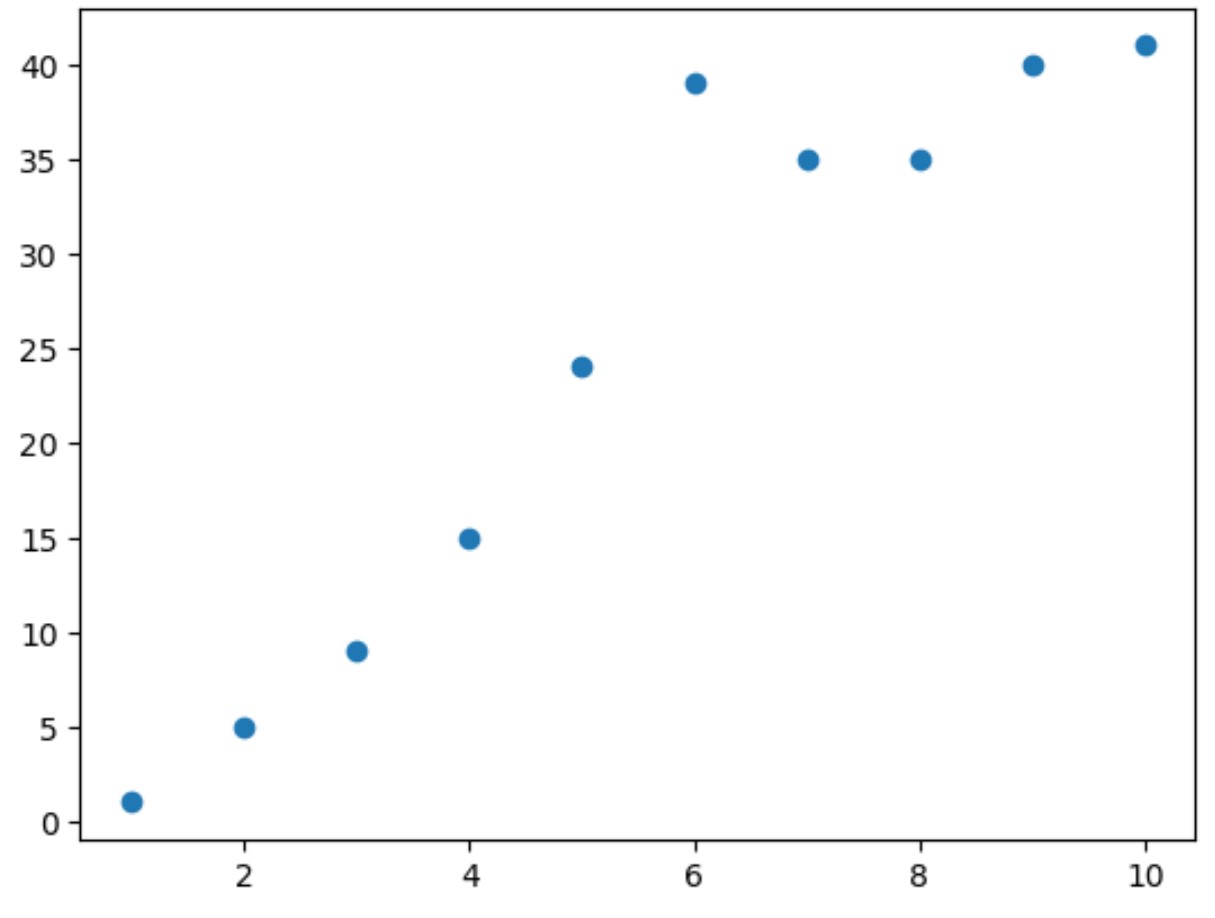
สมมติว่าเราสร้าง Scatterplot ต่อไปนี้ใน Matplotlib:
 import matplotlib. pyplot as plt

#define x and y
x = [1, 2, 3, 4, 5, 6, 7, 8, 9, 10]
y = [1, 5, 9, 15, 24, 39, 35, 35, 40, 41]

#create scatter plot of x vs. y
plt. scatter (x,y)

เราสามารถใช้ไวยากรณ์ต่อไปนี้เพื่อรับขีดจำกัดแกนสำหรับแกน x และ y ของแผนภาพกระจาย:
 import matplotlib. pyplot as plt

#define x and y
x = [1, 2, 3, 4, 5, 6, 7, 8, 9, 10]
y = [1, 5, 9, 15, 24, 39, 35, 35, 40, 41]

#create scatter plot of x vs. y
plt. scatter (x,y)

#get x-axis and y-axis limits
xmin, xmax, ymin, ymax = plt. axis ()

#print axis limits
print (xmin, xmax, ymin, ymax)

0.55 10.45 -1.0 43.0
จากผลลัพธ์เราจะเห็นได้ว่า:
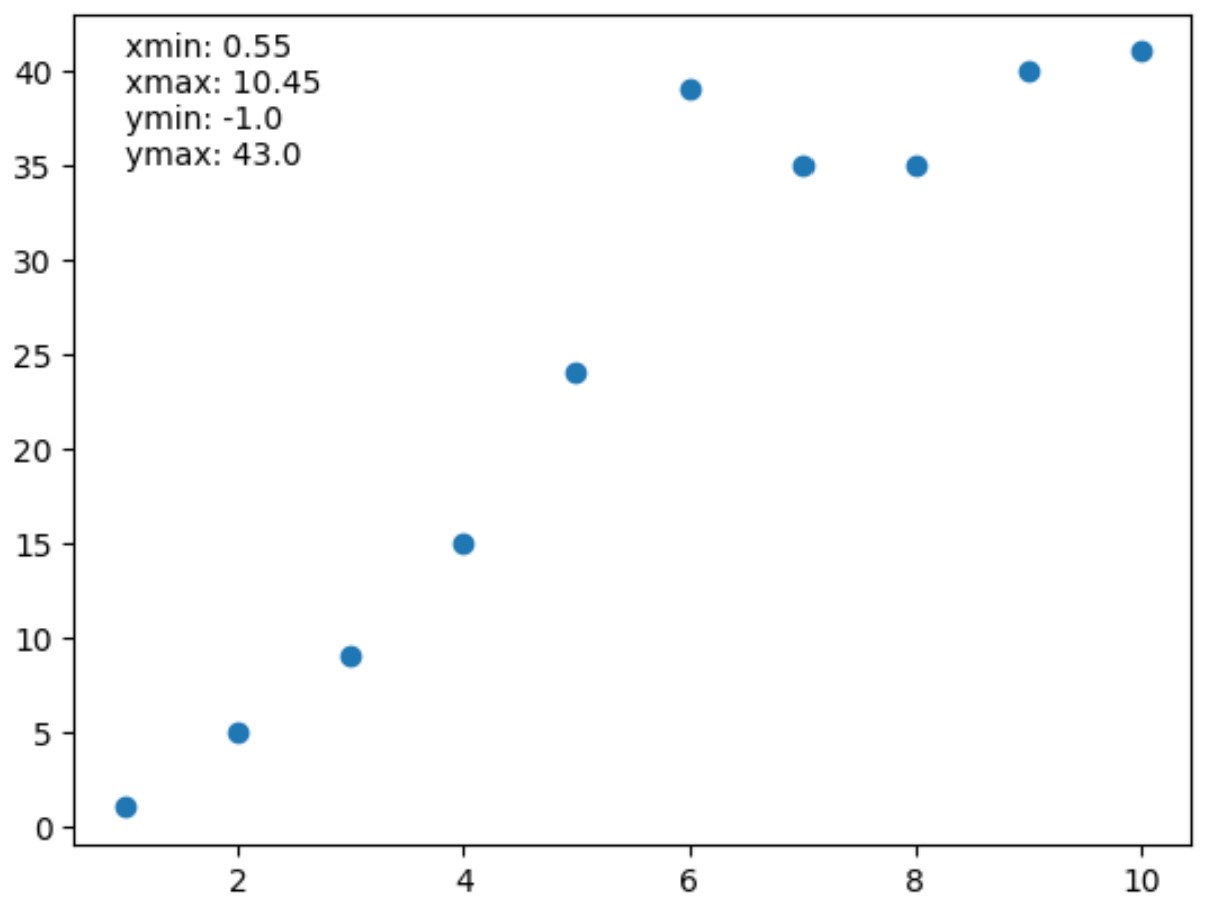
- ขั้นต่ำบนแกน x: 0.55
- สูงสุดบนแกน x: 10.45
- ขั้นต่ำบนแกน y: -1.0
- สูงสุดบนแกน y: 43.0
ค่าเหล่านี้สอดคล้องกับขีดจำกัดของแกนที่มองเห็นได้ในแผนภาพกระจายด้านบน
นอกจากนี้เรายังสามารถใช้ฟังก์ชัน คำอธิบายประกอบ () เพื่อเพิ่มขีดจำกัดแกนเหล่านี้เป็นค่าข้อความลงในพล็อตหากเราต้องการ:
 import matplotlib. pyplot as plt

#define x and y
x = [1, 2, 3, 4, 5, 6, 7, 8, 9, 10]
y = [1, 5, 9, 15, 24, 39, 35, 35, 40, 41]

#create scatter plot of x vs. y
plt. scatter (x,y)

#get x-axis and y-axis limits
xmin, xmax, ymin, ymax = plt. axis ()

#print axis limits
lims = ' xmin: ' + str(round(xmin, 2 )) + ' \n ' + \
       ' xmax: ' + str(round(xmax, 2 )) + ' \n ' + \
       ' ymin: ' + str(round(ymin, 2 )) + ' \n ' + \
       ' ymax: ' + str(round(ymax, 2 ))

#add axis limits to plot at (x,y) coordinate (1.35)
plt. annotate (lims, ( 1 , 35 ))

แหล่งข้อมูลเพิ่มเติม
บทช่วยสอนต่อไปนี้จะอธิบายวิธีดำเนินการงานทั่วไปอื่นๆ ใน Matplotlib:
วิธีการตั้งค่าเครื่องหมายแกนใน Matplotlib
วิธีเพิ่มขนาดพล็อตใน Matplotlib
วิธีเพิ่มข้อความลงในแปลง Matplotlib