วิธีสร้าง scatterplot ด้วยเส้นถดถอยใน r
บ่อยครั้งเมื่อเราทำการถดถอยเชิงเส้นอย่างง่าย เราต้องการสร้างแผนภาพกระจายเพื่อให้เห็นภาพการผสมค่า x และ y แบบต่างๆ
โชคดีที่ R ทำให้การสร้างพอยต์คลาวด์เป็นเรื่องง่ายโดยใช้ฟังก์ชัน plot() ตัวอย่างเช่น:
 #create some fake data
data <- data.frame(x = c(1, 1, 2, 3, 4, 4, 5, 6, 7, 7, 8, 9, 10, 11, 11),
                   y = c(13, 14, 17, 12, 23, 24, 25, 25, 24, 28, 32, 33, 35, 40, 41))

#create scatterplot of data
plot(data$x, data$y)
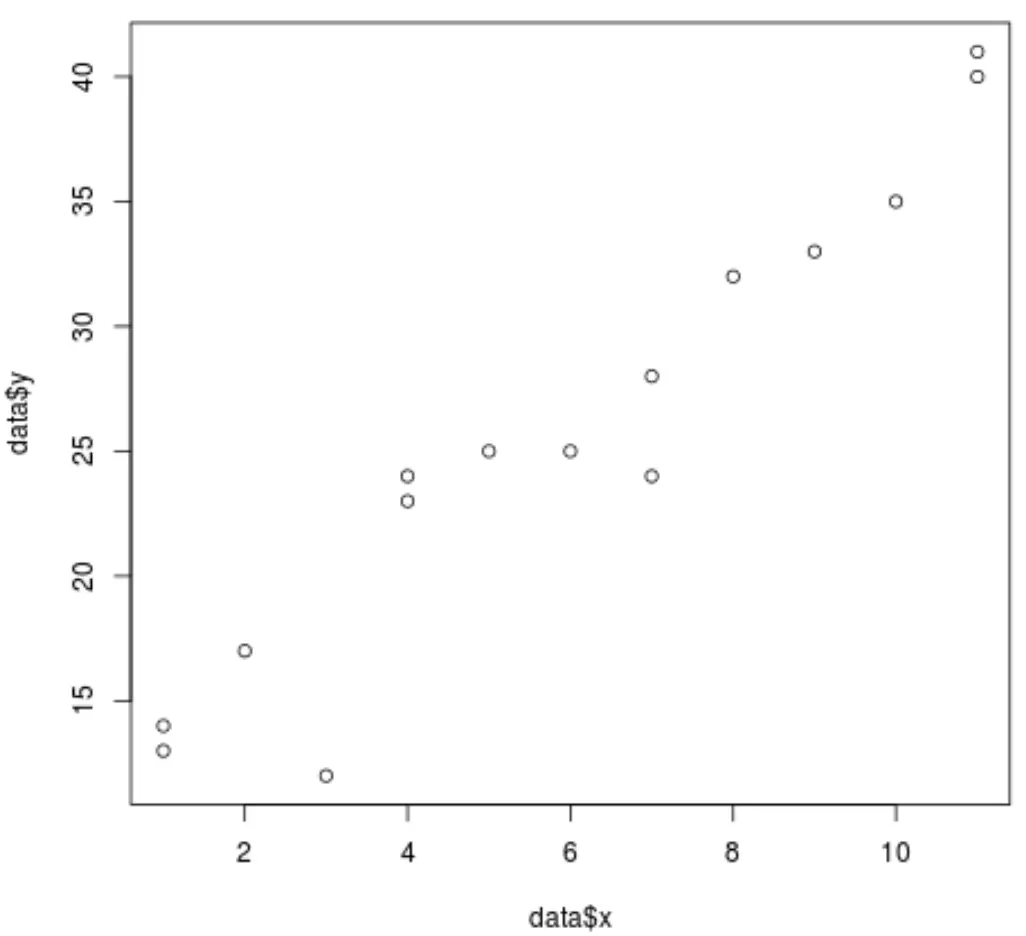
นอกจากนี้ยังง่ายต่อการเพิ่มเส้นการถดถอยลงใน Scatterplot โดยใช้ฟังก์ชัน abline()
ตัวอย่างเช่น:
 #fit a simple linear regression model
model <- lm(y ~ x, data = data)

#add the fitted regression line to the scatterplot
abline(model)
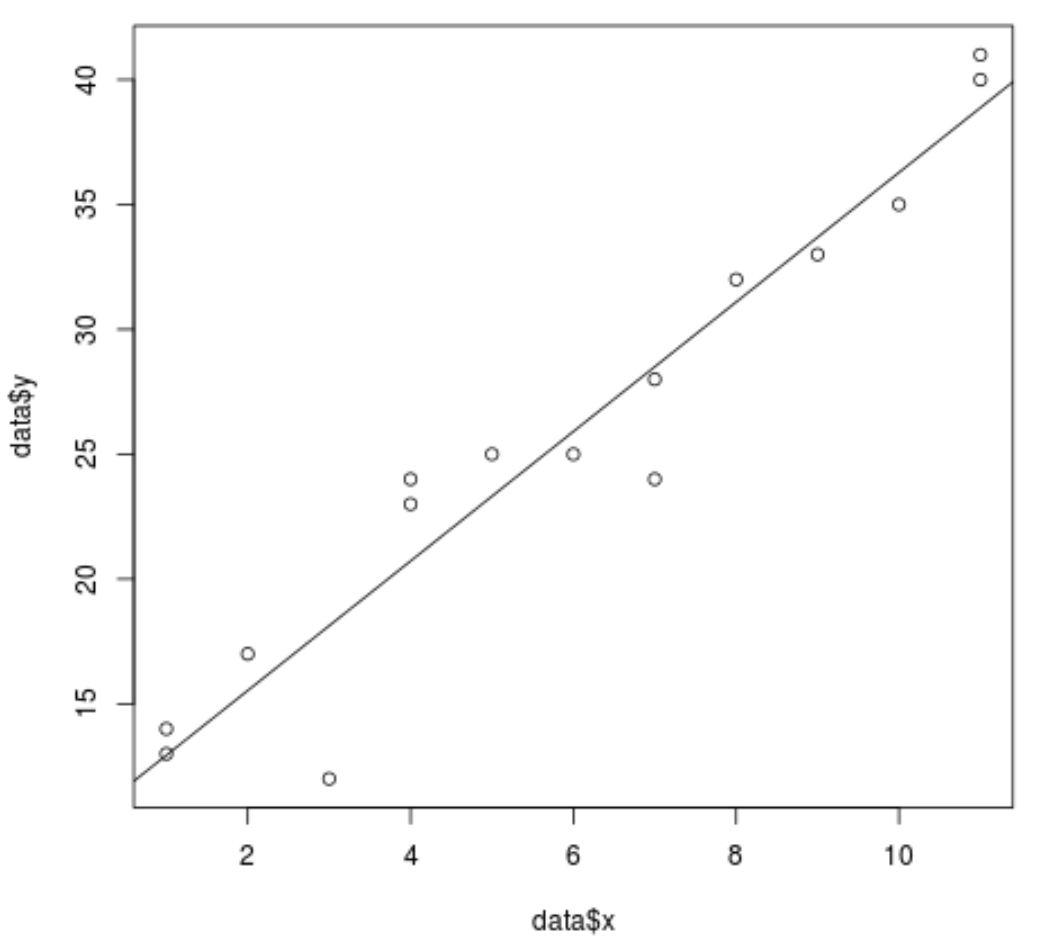
นอกจากนี้เรายังสามารถเพิ่มเส้นช่วงความมั่นใจให้กับพล็อตโดยใช้ฟังก์ชัน ทำนาย () ได้ :
 #define range of x values
newx = seq(min(data$x),max(data$x),by = 1)

#find 95% confidence interval for the range of x values
conf_interval <- predict(model, newdata=data.frame(x=newx), interval="confidence",
                         level = 0.95)

#create scatterplot of values with regression line
plot(data$x, data$y)
abline(model)

#add dashed lines (lty=2) for the 95% confidence interval
lines(newx, conf_interval[,2], col="blue", lty=2)
lines(newx, conf_interval[,3], col="blue", lty=2)
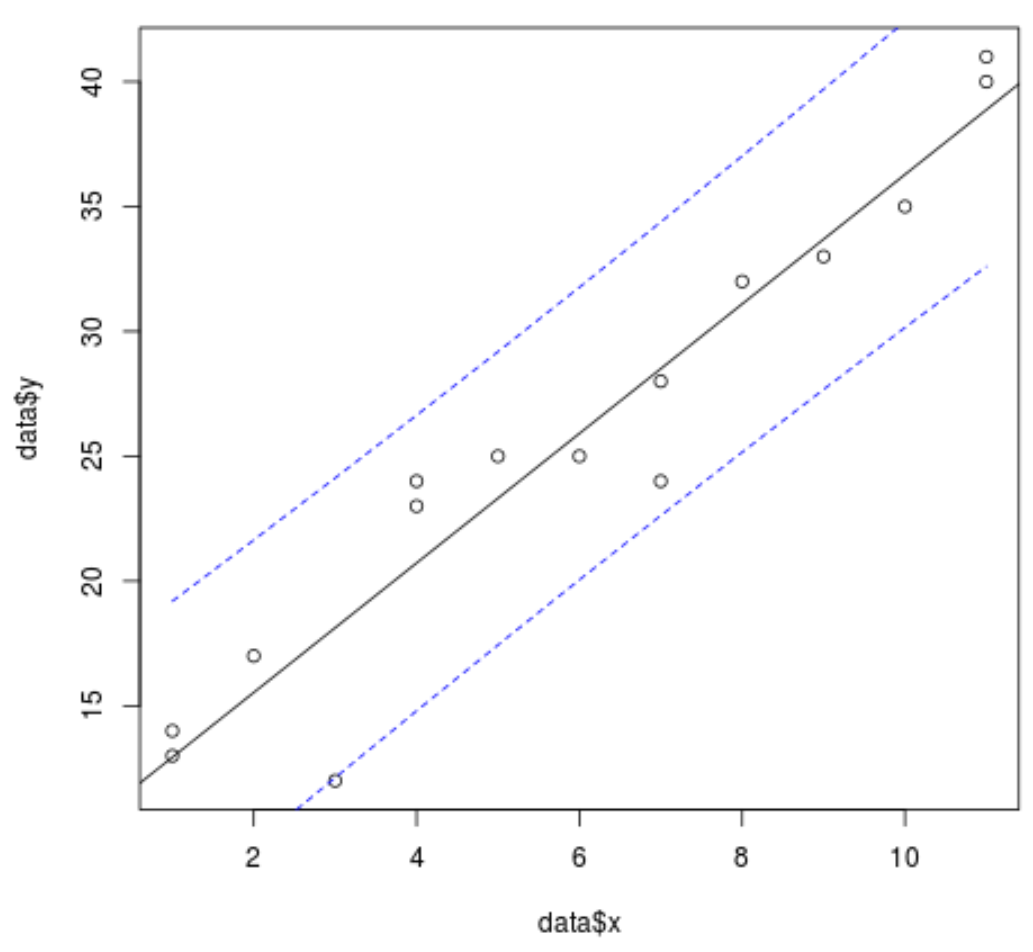
หรือเราอาจเพิ่มบรรทัดช่วงเวลาการทำนายลงในพล็อตแทนโดยการระบุประเภทช่วงเวลาในฟังก์ชัน การทำนาย () :
 #define range of x values
newx = seq(min(data$x),max(data$x),by = 1)

#find 95% prediction interval for the range of x values
pred_interval <- predict(model, newdata=data.frame(x=newx), interval="prediction" ,
                         level = 0.95)

#create scatterplot of values with regression line
plot(data$x, data$y)
abline(model)

#add dashed lines (lty=2) for the 95% confidence interval
lines(newx, pred_interval[,2], col="red", lty=2)
lines(newx, pred_interval[,3], col="red", lty=2)
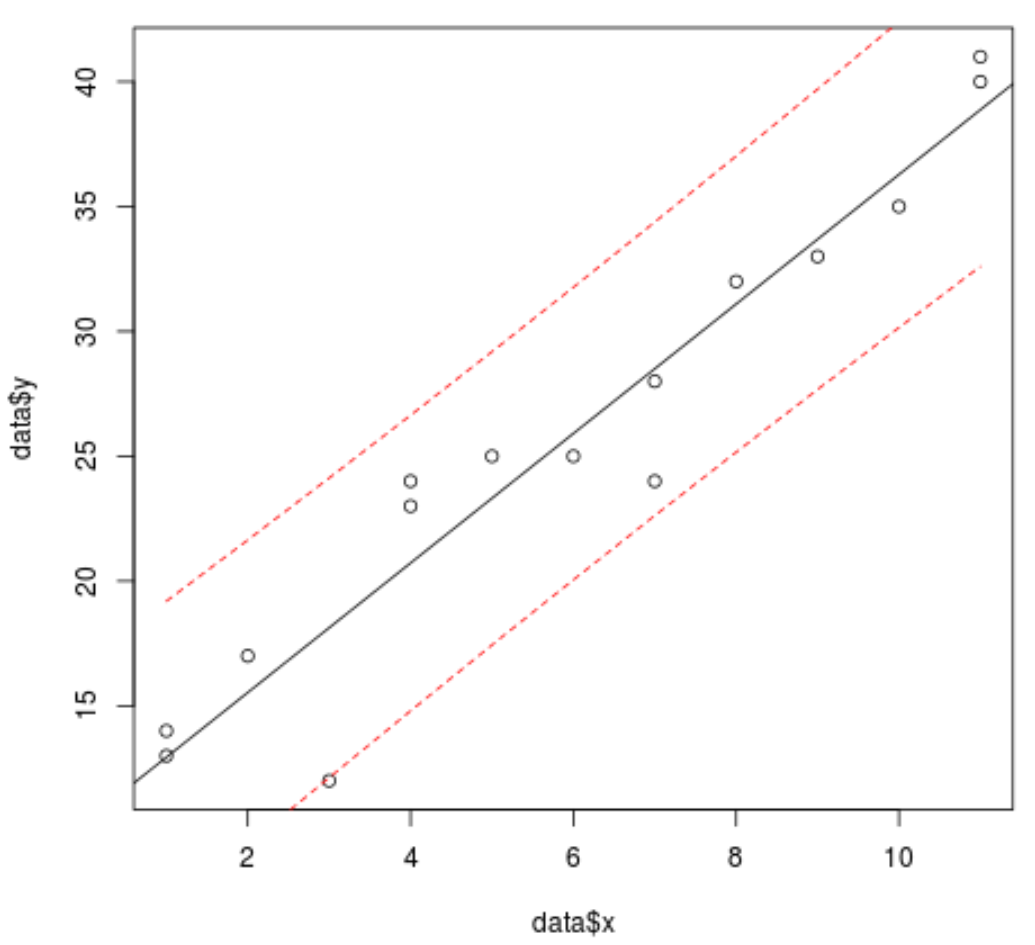
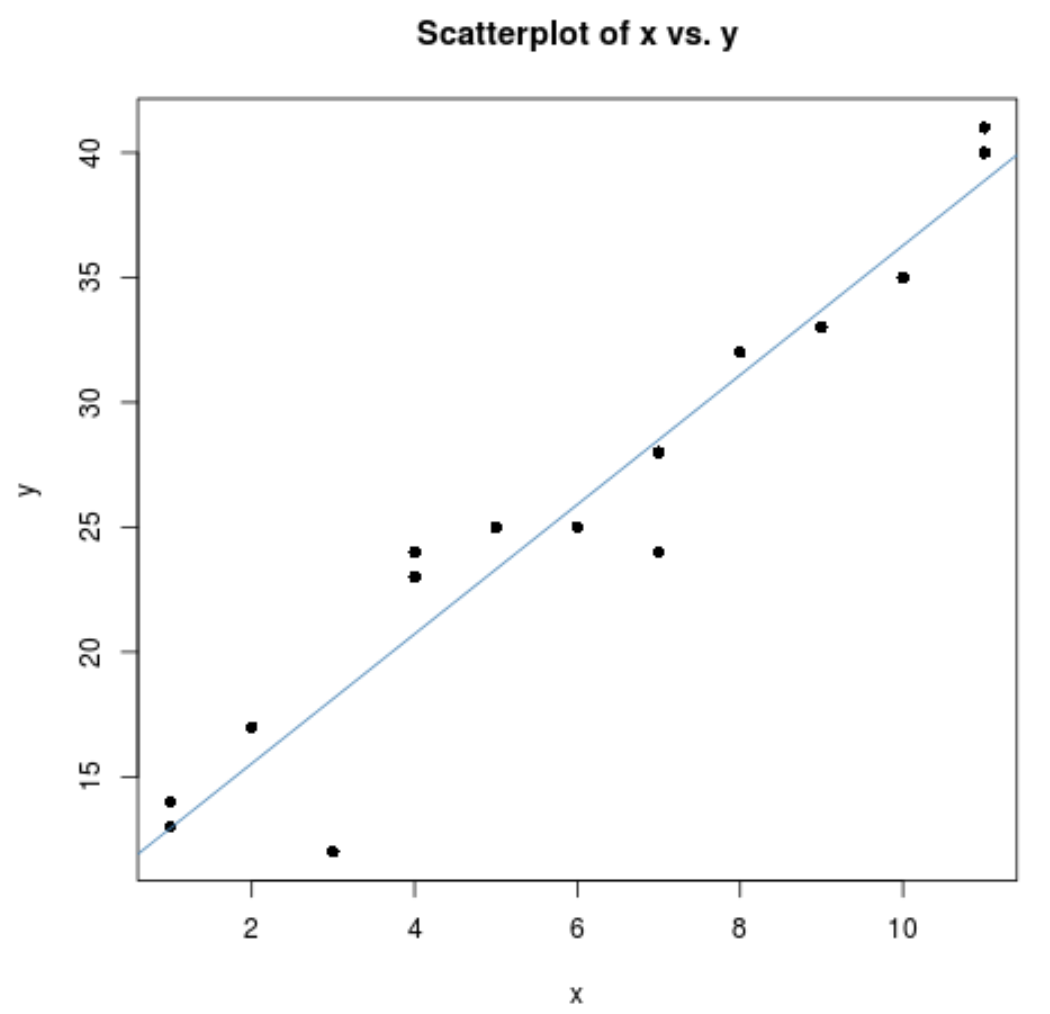
สุดท้ายนี้ เราสามารถทำให้พล็อตมีความสวยงามมากขึ้นได้โดยการเพิ่มชื่อเรื่อง เปลี่ยนชื่อแกน และเปลี่ยนรูปร่างของจุดพล็อตแต่ละจุด
 plot(data$x, data$y,
     main = "Scatterplot of x vs. y", #add title
     pch=16, #specify points to be filled in
     xlab='x', #change x-axis name
ylab='y') #change y-axis name

abline(model, col='steelblue') #specify color of regression line
แหล่งข้อมูลเพิ่มเติม
บทช่วยสอนต่อไปนี้จะอธิบายวิธีดำเนินการงานทั่วไปอื่นๆ ใน R:
วิธีติดป้ายกำกับจุดบน Scatterplot ใน R
วิธีใช้ฟังก์ชัน Jitter ใน R สำหรับ point cloud