วิธีใช้ facet_wrap ใน r (พร้อมตัวอย่าง)
ฟังก์ชัน facet_wrap() สามารถใช้เพื่อสร้างพล็อตแบบหลายแผงใน ggplot2
ฟังก์ชันนี้ใช้ไวยากรณ์พื้นฐานต่อไปนี้:
 library (ggplot2)

ggplot(df, aes (x_var, y_var)) +
  geom_point() +
  facet_wrap(vars(category_var))
ตัวอย่างต่อไปนี้แสดงวิธีใช้ฟังก์ชันนี้กับชุดข้อมูล mpg ในตัวใน R:
 #view first six rows of mpg dataset
head(mpg)

manufacturer model displ year cyl trans drv cty hwy fl class

audi a4 1.8 1999 4 auto(l5) f 18 29 p compact
audi a4 1.8 1999 4 manual(m5) f 21 29 p compact
audi a4 2.0 2008 4 manual(m6) f 20 31 p compact
audi a4 2.0 2008 4 auto(front) f 21 30 p compact
audi a4 2.8 1999 6 auto(l5) f 16 26 p compact
audi a4 2.8 1999 6 manual(m5) f 18 26 p compact
ตัวอย่างที่ 1: facet_wrap() ฟังก์ชันพื้นฐาน
โค้ดต่อไปนี้แสดงวิธีสร้าง Scatterplot หลายรายการใน ggplot2 โดยใช้ displ เป็นตัวแปรแกน x, hwy เป็นตัวแปรแกน y และ คลาส เป็นตัวแปรการจัดกลุ่ม:
 ggplot(mpg, aes (displ, hwy)) +
  geom_point() +
  facet_wrap(vars(class))

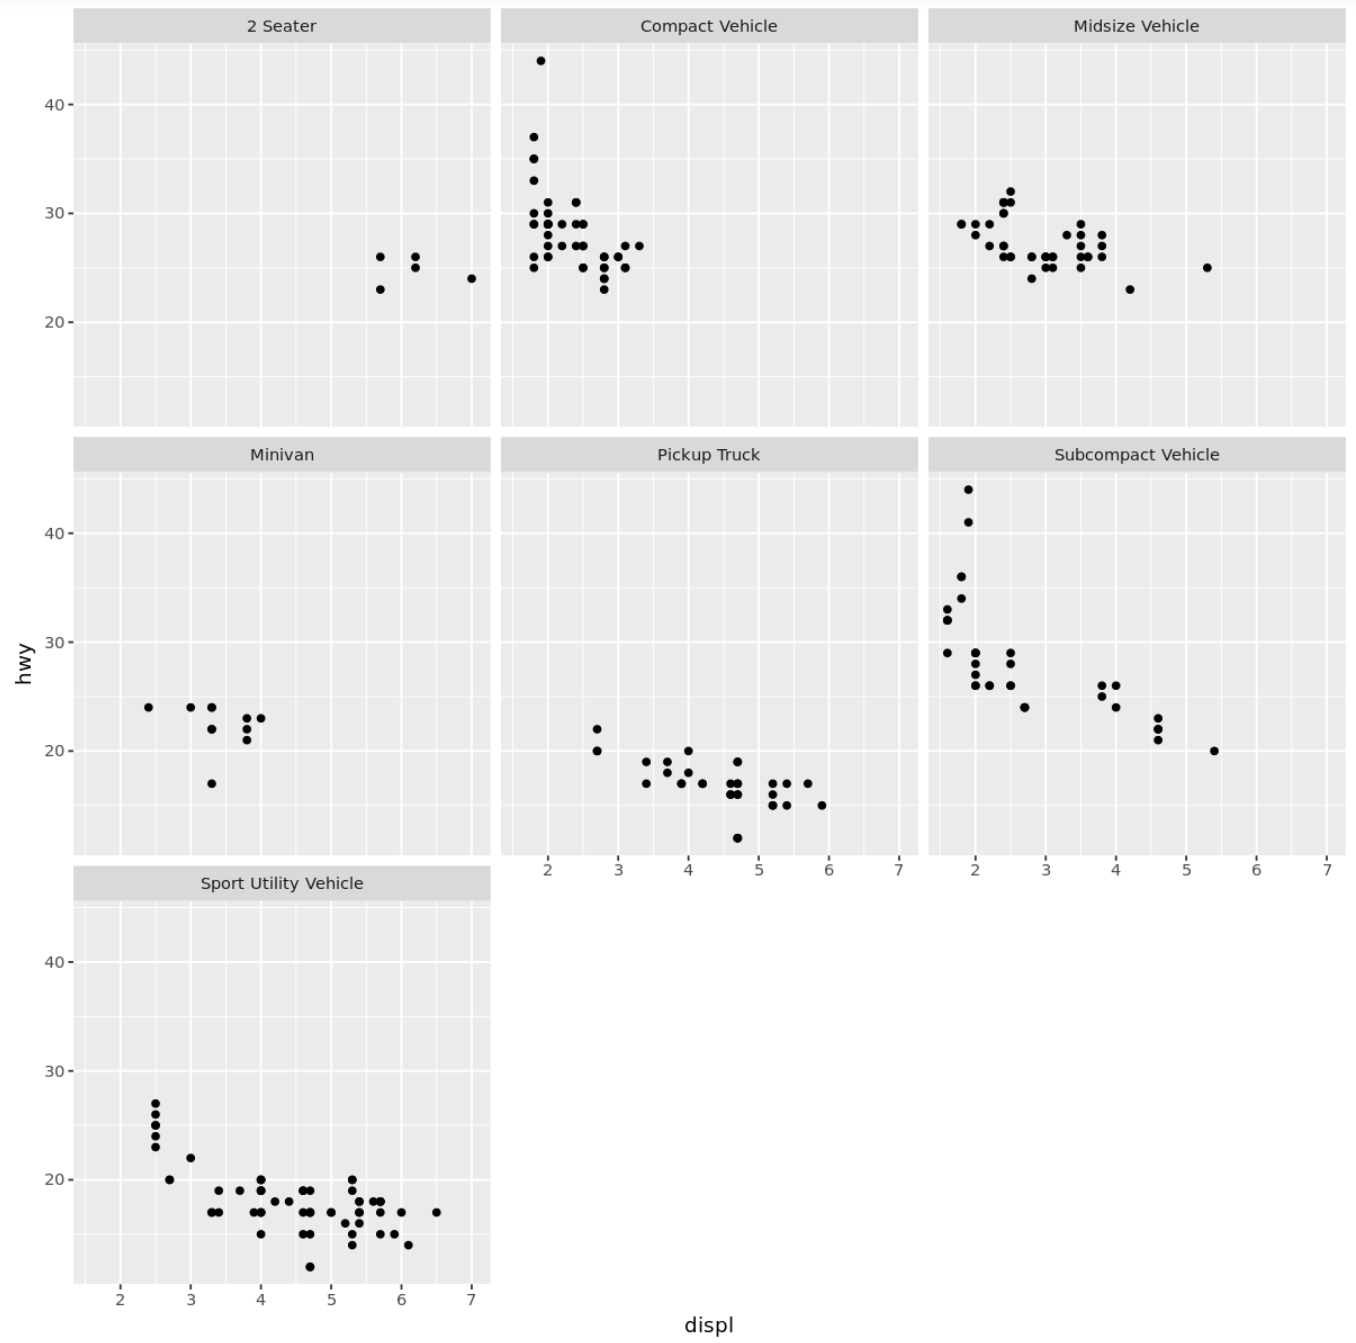
ตัวอย่างที่ 2: ใช้ป้ายกำกับที่กำหนดเอง
รหัสต่อไปนี้แสดงวิธีใช้ฟังก์ชัน facet_wrap() พร้อมป้ายกำกับที่กำหนดเองสำหรับชื่อโครงเรื่อง:
 #define custom labels
plot_names <- c('2seater' = "2 Seater",
                'compact' = "Compact Vehicle",
                'midsize' = "Midsize Vehicle",
                'minivan' = "Minivan",
                'pickup' = "Pickup Truck",
                'subcompact' = "Subcompact Vehicle",
                'suv' = "Sport Utility Vehicle")

#use facet_wrap with custom plot labels
ggplot(mpg, aes (displ, hwy)) +
  geom_point() +
  facet_wrap(vars(class), labeller = as_labeller (plot_names))

ตัวอย่างที่ 3: ใช้มาตราส่วนแบบกำหนดเอง
รหัสต่อไปนี้แสดงวิธีใช้ฟังก์ชัน facet_wrap() พร้อมมาตราส่วนที่กำหนดเองสำหรับแต่ละพล็อต:
 #use facet_wrap with custom scales
ggplot(mpg, aes (displ, hwy)) +
  geom_point() +
  facet_wrap(vars(class), scales=' free ')

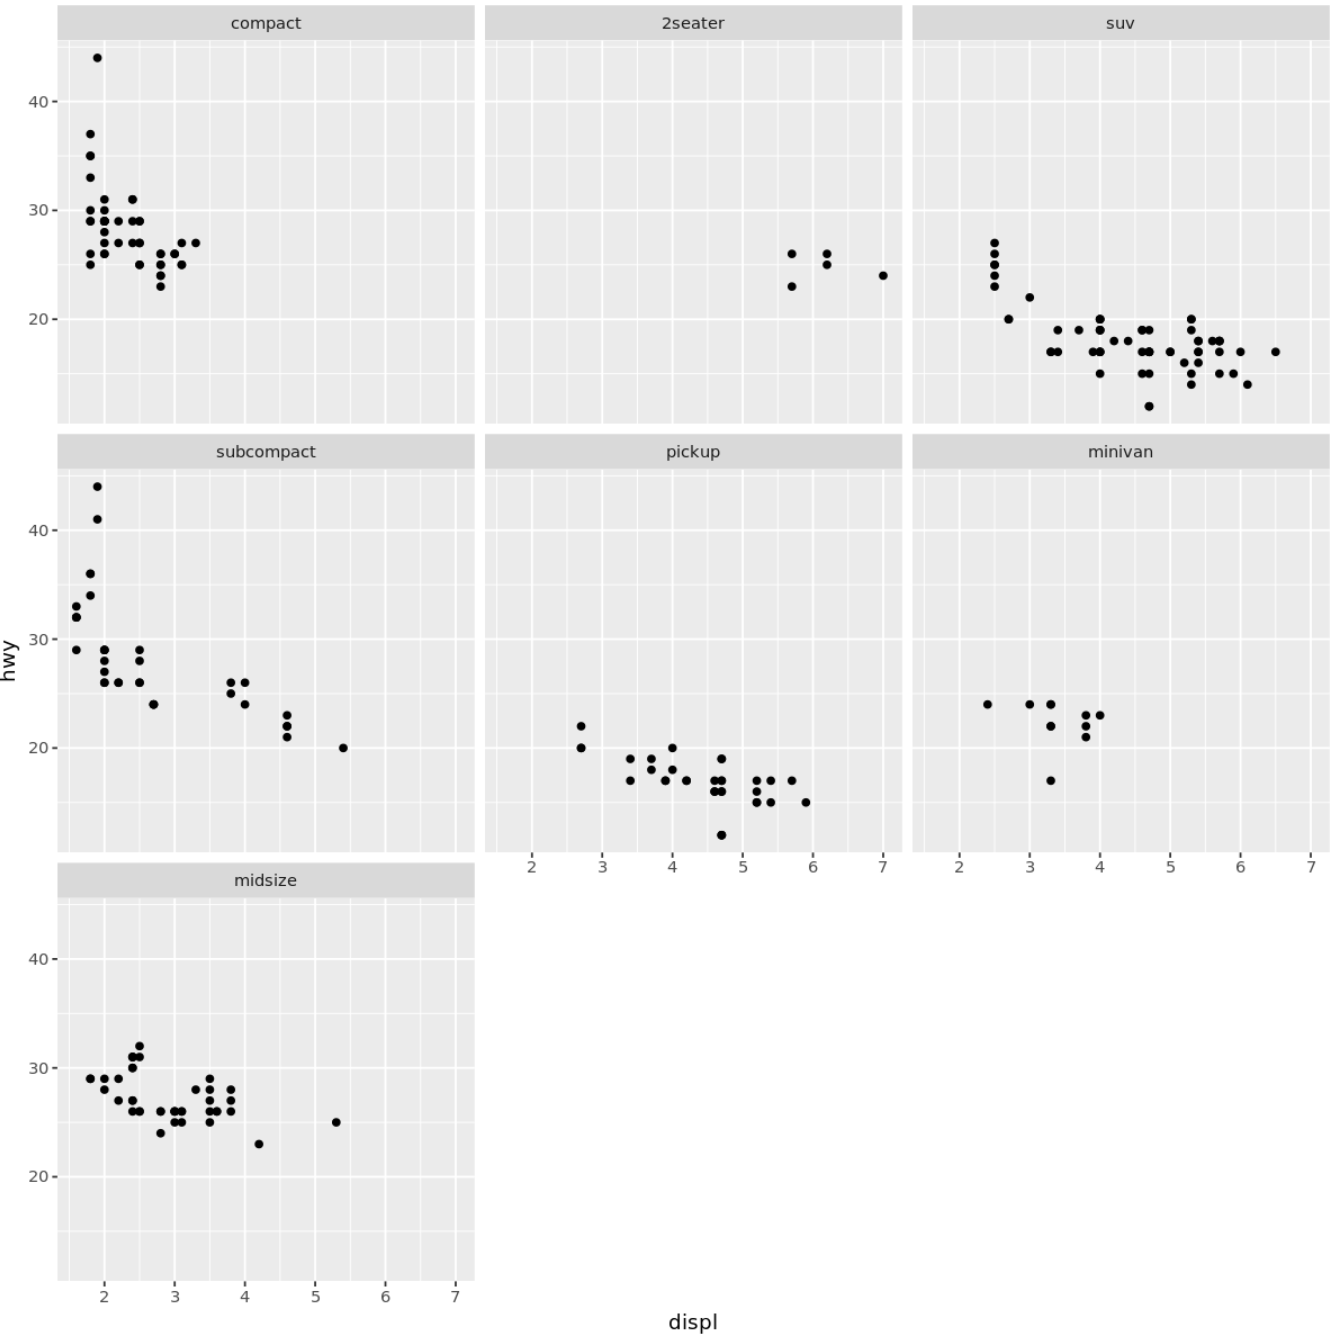
ตัวอย่างที่ 4: ใช้คำสั่งที่กำหนดเอง
รหัสต่อไปนี้แสดงวิธีใช้ฟังก์ชัน facet_wrap() พร้อมการเรียงลำดับแบบกำหนดเองสำหรับแต่ละแปลง:
 #define order for plots
mpg <- within(mpg, class <- factor(class, levels=c(' compact ', ' 2seater ', ' suv ',
                                                   ' subcompact ', ' pickup ',
                                                   ' minivan ', ' midsize ')))

#use facet_wrap with custom order
ggplot(mpg, aes (displ, hwy)) +
  geom_point() +
  facet_wrap(vars(class))

โปรดทราบว่าแปลงปรากฏในลำดับที่แน่นอนที่เราระบุ
แหล่งข้อมูลเพิ่มเติม
วิธีเปลี่ยนขนาดตัวอักษรใน ggplot2
วิธีลบคำอธิบายแผนภูมิใน ggplot2
วิธีหมุนป้ายกำกับแกนใน ggplot2