วิธีใช้ geom_abline เพื่อเพิ่มเส้นตรงใน ggplot2
คุณสามารถใช้ฟังก์ชัน geom_abline() และฟังก์ชัน geom ที่คล้ายกันอื่นๆ เพื่อเพิ่มเส้นตรงลงในพล็อตใน ggplot2
ต่อไปนี้เป็นวิธีทั่วไปในการใช้ฟังก์ชันเหล่านี้:
วิธีที่ 1: ใช้ geom_abline() เพื่อเพิ่มความชันและจุดตัด
 ggplot(df, aes(x, y)) +
  geom_point() +
  geom_abline(slope= 3 , intercept= 15 )
วิธีที่ 2: ใช้ geom_vline() เพื่อเพิ่มเส้นแนวตั้ง
 ggplot(df, aes(x=xvar, y=yvar)) +
    geom_point() +
    geom_vline(xintercept= 5 )
วิธีที่ 3: ใช้ geom_hline() เพื่อเพิ่มเส้นแนวนอน
 ggplot(df, aes(x=xvar, y=yvar)) +
    geom_point() +
    geom_hline(yintercept= 25 )
วิธีที่ 4: ใช้ geom_smooth() เพื่อเพิ่มเส้นการถดถอย
 ggplot(df, aes(x=xvar, y=yvar)) +
    geom_point() +
    geom_smooth(method=' lm ')
ตัวอย่างต่อไปนี้แสดงวิธีการใช้แต่ละวิธีในทางปฏิบัติกับกรอบข้อมูลต่อไปนี้ใน R:
 #create data frame
df <- data. frame (x=c(1, 2, 3, 3, 5, 7, 9),
                 y=c(8, 14, 18, 25, 29, 33, 25))

#view data frame
df

  xy
1 1 8
2 2 14
3 3 18
4 3 25
5 5 29
6 7 33
7 9 25
ตัวอย่างที่ 1: ใช้ geom_abline() เพื่อเพิ่มความชันและจุดตัด
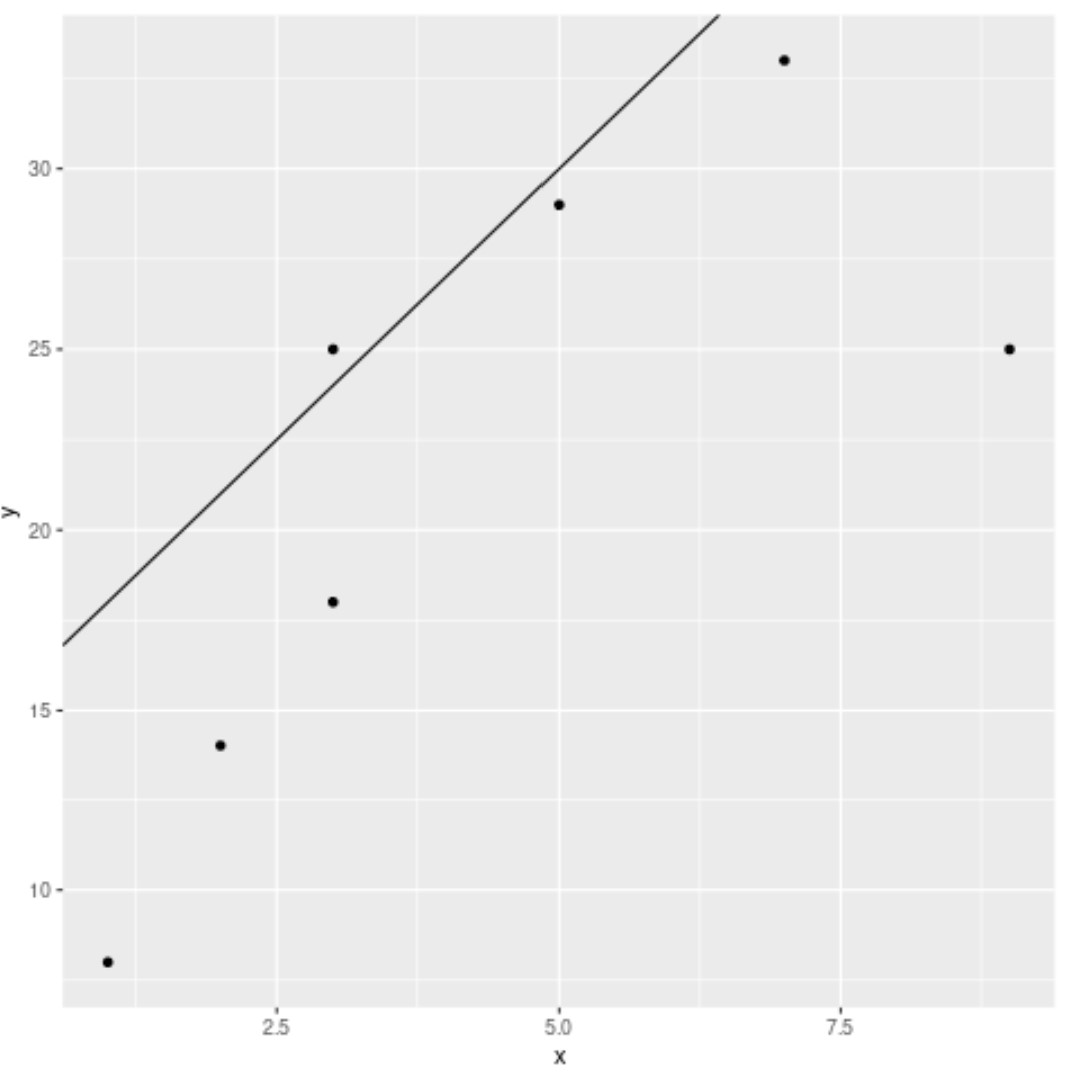
โค้ดต่อไปนี้แสดงวิธีใช้ geom_abline() เพื่อเพิ่มเส้นตรงให้กับ Scatterplot ที่มีความชัน 3 และค่าตัดแกน y เท่ากับ 15:
 library (ggplot2)

#create scatterplot and add straight line with specific slope and intercept
ggplot(df, aes(x=x, y=y)) +
  geom_point() +
  geom_abline(slope= 3 , intercept= 15 )
ตัวอย่างที่ 2: ใช้ geom_vline() เพื่อเพิ่มเส้นแนวตั้ง
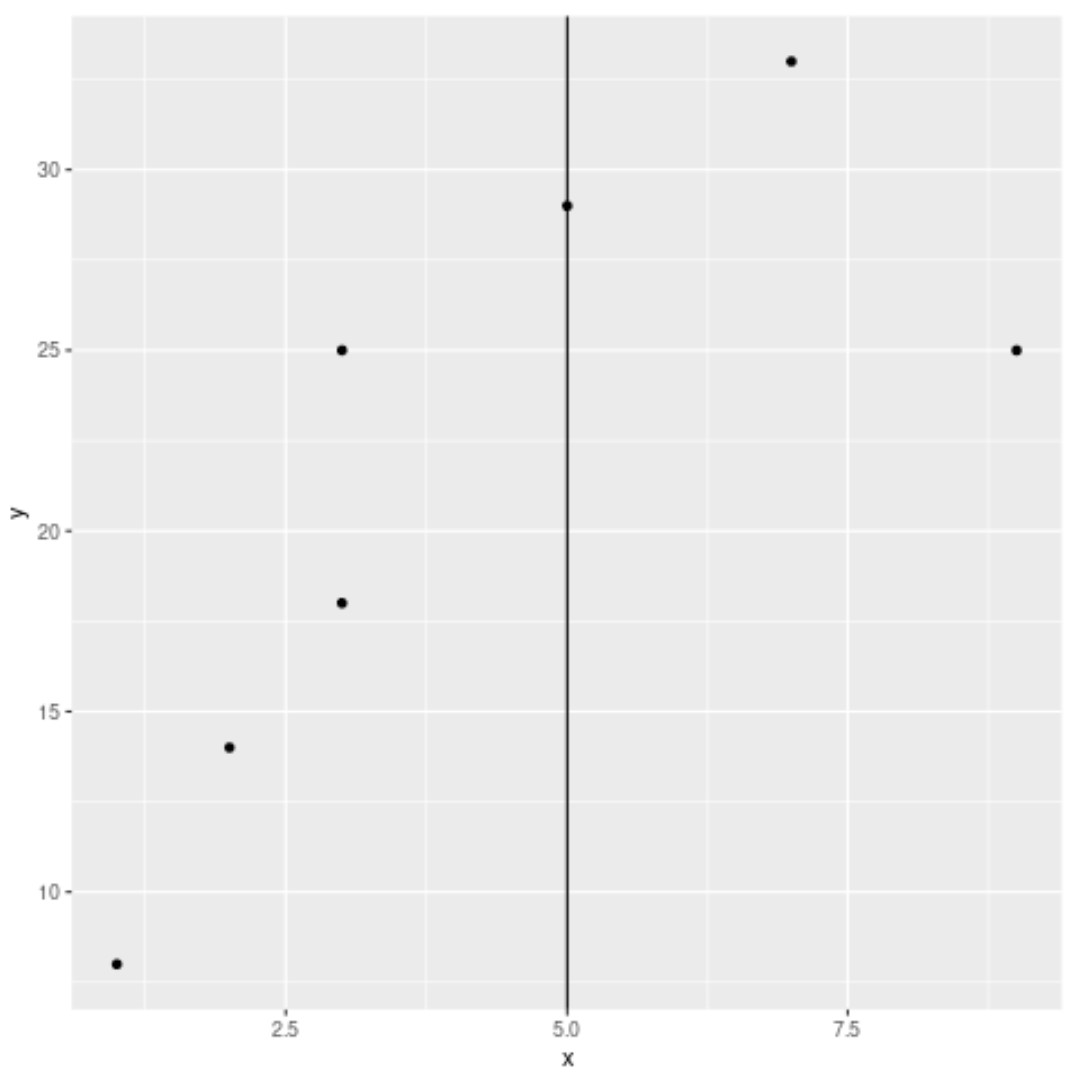
โค้ดต่อไปนี้แสดงวิธีใช้ geom_vline() เพื่อเพิ่มเส้นแนวตั้งให้กับแผนภาพกระจายที่ x=5:
 library (ggplot2)

#create scatterplot and add vertical line at x=5
ggplot(df, aes(x=x, y=y)) +
  geom_point() +
  geom_vline(xintercept= 5 )
ตัวอย่างที่ 3: ใช้ geom_hline() เพื่อเพิ่มเส้นแนวนอน
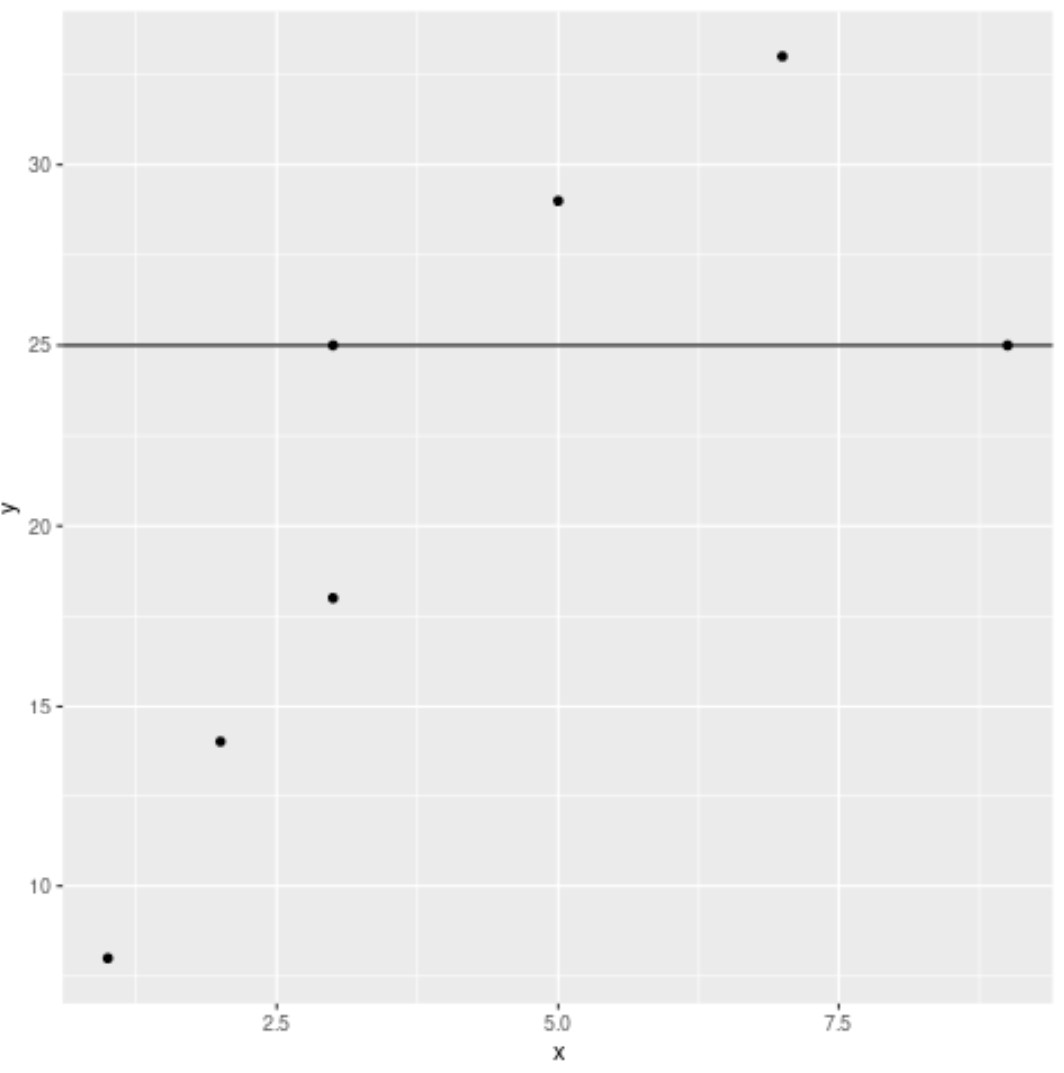
โค้ดต่อไปนี้แสดงวิธีใช้ geom_hline() เพื่อเพิ่มเส้นแนวนอนให้กับแผนภาพกระจายที่ y=25:
 library (ggplot2)

#create scatterplot and add horizontal line at y=25
ggplot(df, aes(x=x, y=y)) +
  geom_point() +
  geom_hline(yintercept= 25 )
ตัวอย่างที่ 4: ใช้ geom_smooth() เพื่อเพิ่มเส้นการถดถอย
รหัสต่อไปนี้แสดงวิธีใช้ geom_smooth() เพื่อเพิ่มเส้นการถดถอยที่พอดีลงใน Scatterplot:
 library (ggplot2)

#create scatterplot and add fitted regression line
ggplot(df, aes(x=x, y=y)) +
  geom_point() +
  geom_smooth(method=' lm ', se= FALSE )
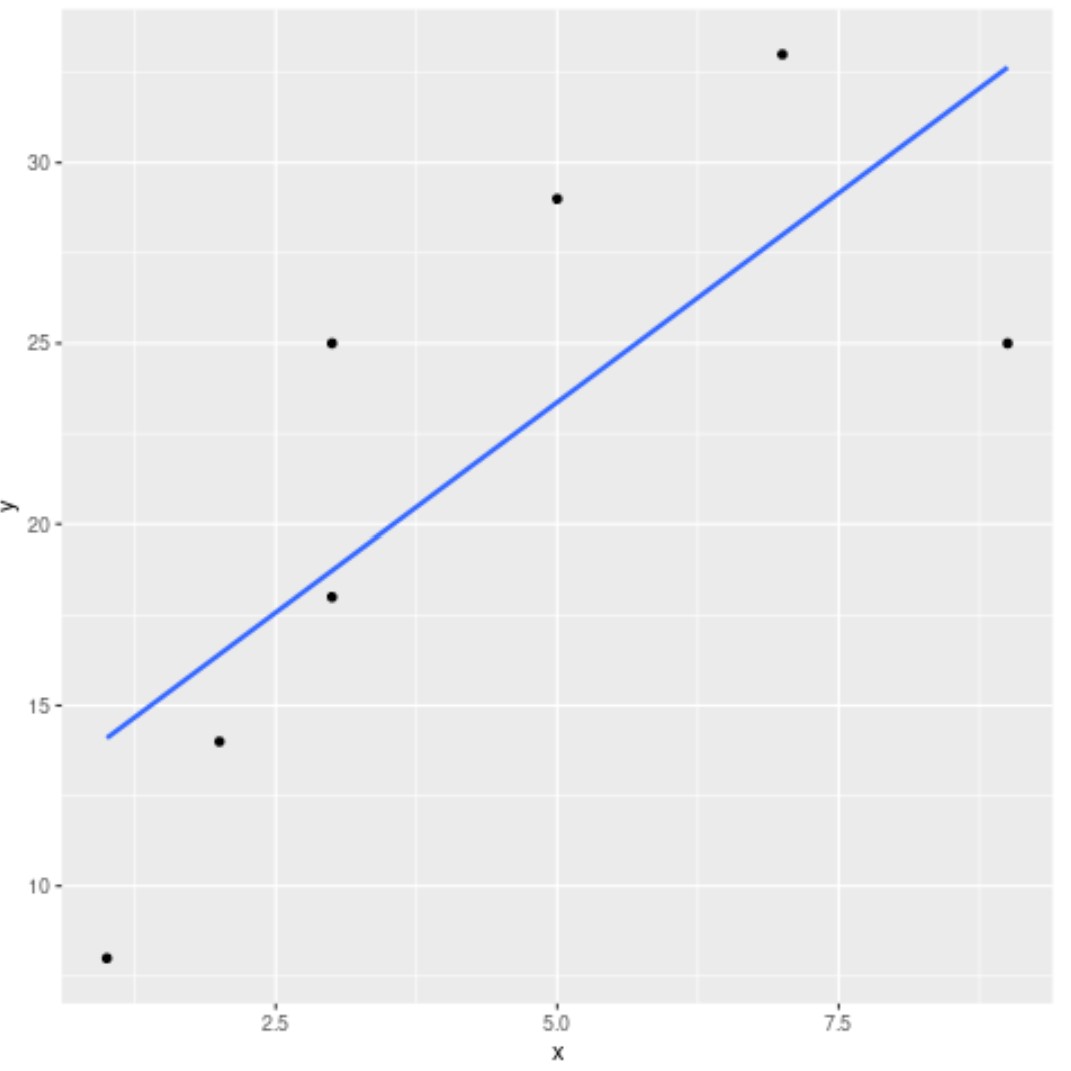
หมายเหตุ : อาร์กิวเมนต์ se=FALSE บอกให้ ggplot2 ไม่ต้องแสดงเส้นแรเงาสำหรับการประมาณค่าข้อผิดพลาดมาตรฐาน
แหล่งข้อมูลเพิ่มเติม
บทช่วยสอนต่อไปนี้จะอธิบายวิธีดำเนินการอื่นๆ ที่ใช้กันทั่วไปใน ggplot2:
วิธีปรับความหนาของเส้นใน ggplot2
วิธีตั้งค่าขีดจำกัดแกนใน ggplot2
วิธีลบเส้นตารางใน ggplot2
วิธีเปลี่ยนสีพื้นหลังใน ggplot2
เกี่ยวกับผู้แต่ง
ดร.เบนจามิน แอนเดอร์สัน
สวัสดี ฉันชื่อเบนจามิน ศาสตราจารย์สถิติเกษียณอายุแล้ว และผันตัวมาเป็นครูสอนสถิติโดยเฉพาะ ด้วยประสบการณ์และความเชี่ยวชาญที่กว้างขวางในสาขาสถิติ ฉันกระตือรือร้นที่จะแบ่งปันความรู้ของฉันเพื่อเสริมศักยภาพนักเรียนผ่าน Statorials. รู้เพิ่มเติม