วิธีเพิ่มเส้นแนวนอนให้กับพล็อตโดยใช้ ggplot2
คุณสามารถเพิ่มเส้นแนวนอนลงในแปลง ggplot2 ได้อย่างรวดเร็วโดยใช้ฟังก์ชัน geom_hline() ซึ่งใช้ไวยากรณ์ต่อไปนี้:
geom_hline(yintercept, linetype, สี, ขนาด)
ทอง:
- yintercept: ตำแหน่งที่จะเพิ่มบรรทัดบนจุดตัด y
- ประเภทเส้น: เส้นสไตล์. ค่าเริ่มต้นคือ “ทึบ” แต่คุณสามารถระบุ “twodash”, “longdash”, “dotted”, “dotdash”, “dash” หรือ “blank” ได้
- สี: สีของเส้น
- ขนาด: ความกว้างของเส้น
ตัวอย่างต่อไปนี้แสดงวิธีใช้ฟังก์ชันนี้ในทางปฏิบัติ
เพิ่มเส้นแนวนอนเส้นเดียวให้กับเส้นทาง
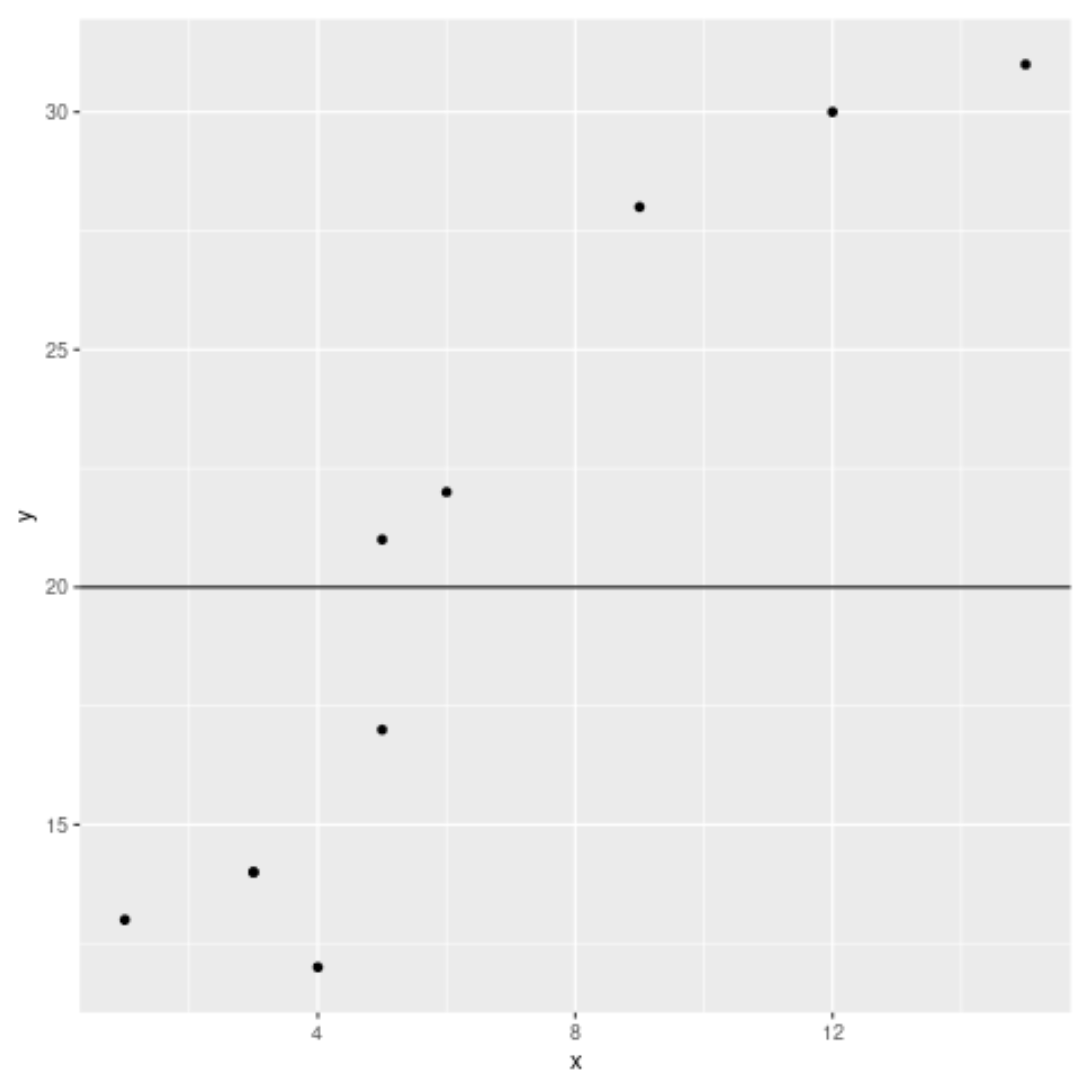
รหัสต่อไปนี้แสดงวิธีการเพิ่มเส้นแนวนอนเส้นเดียวในการลงจุด:
 library (ggplot2)

#create data frame
df <- data. frame (x=c(1, 3, 3, 4, 5, 5, 6, 9, 12, 15),
                 y=c(13, 14, 14, 12, 17, 21, 22, 28, 30, 31))

#create scatterplot with horizontal line at y=20
ggplot(df, aes (x=x, y=y)) +
  geom_point() +
  geom_hline(yintercept= 20 )

เพิ่มเส้นแนวนอนหลายเส้นให้กับเส้นทาง
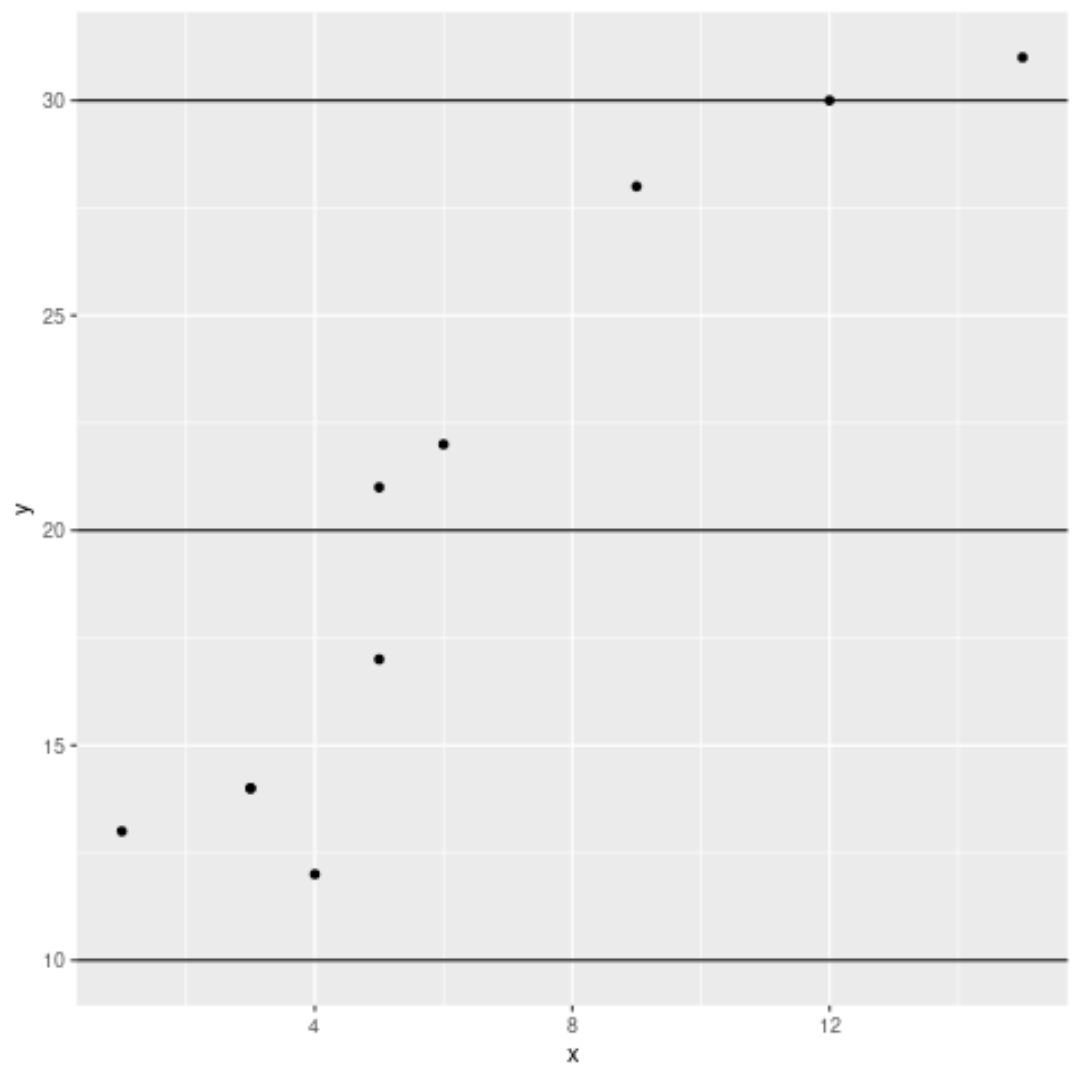
รหัสต่อไปนี้แสดงวิธีการเพิ่มเส้นแนวนอนหลายเส้นลงในพล็อต:
 library (ggplot2)

#create data frame
df <- data. frame (x=c(1, 3, 3, 4, 5, 5, 6, 9, 12, 15),
                 y=c(13, 14, 14, 12, 17, 21, 22, 28, 30, 31))

#create scatterplot with horizontal lines at y = 10, 20, 30
ggplot(df, aes (x=x, y=y)) +
  geom_point() +
  geom_hline(yintercept=c( 10, 20, 30 ))

ปรับแต่งเส้นแนวนอน
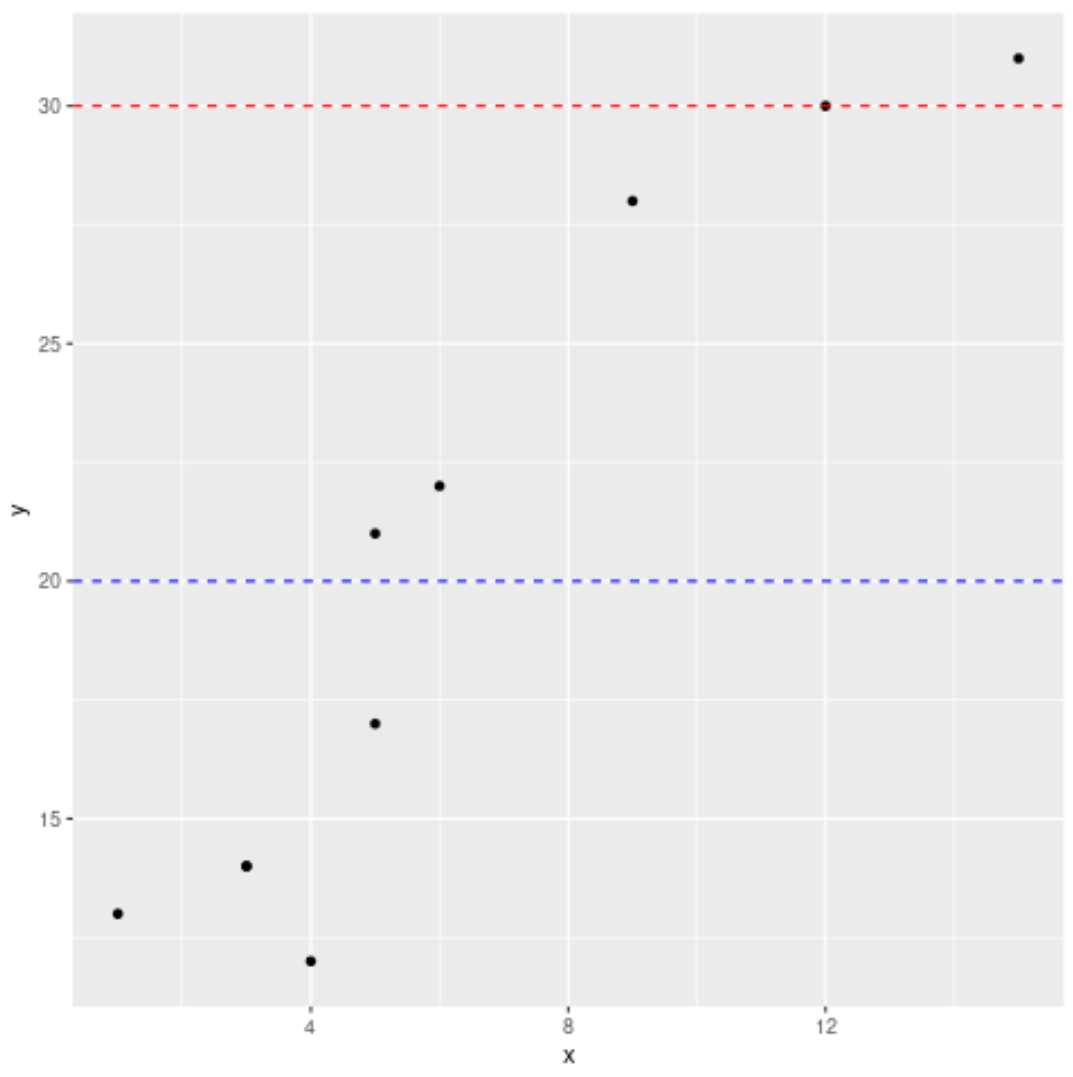
รหัสต่อไปนี้แสดงวิธีปรับแต่งเส้นแนวนอนบนโครงเรื่อง:
 library (ggplot2)

#create data frame
df <- data. frame (x=c(1, 3, 3, 4, 5, 5, 6, 9, 12, 15),
                 y=c(13, 14, 14, 12, 17, 21, 22, 28, 30, 31))

#create scatterplot with customized horizontal lines
ggplot(df, aes (x=x, y=y)) +
  geom_point() +
  geom_hline(yintercept=c( 20 , 30 ) , linetype=' dashed ', color=c(' blue ', ' red '))

แหล่งข้อมูลเพิ่มเติม
วิธีเพิ่มเส้นแนวตั้งให้กับพล็อตโดยใช้ ggplot2
วิธีการพล็อตเส้นการถดถอยเชิงเส้นใน ggplot2
วิธีตั้งค่าขีดจำกัดแกนใน ggplot2