วิธีใช้สไตล์ ggplot ในแปลง matplotlib
หนึ่งในแพ็คเกจการแสดงข้อมูลที่ได้รับความนิยมมากที่สุดในภาษาการเขียนโปรแกรม R คือ ggplot2
หากต้องการใช้สไตล์ ggplot2 กับพล็อตที่สร้างใน Matplotlib คุณสามารถใช้ไวยากรณ์ต่อไปนี้:
 import matplotlib. pyplot as plt

plt. style . use (' ggplot ')
ตัวอย่างต่อไปนี้แสดงวิธีใช้ไวยากรณ์นี้ในทางปฏิบัติ
ตัวอย่าง: การใช้สไตล์ ggplot ในแปลง Matplotlib
สมมติว่าเรามีอาร์เรย์ NumPy ที่มีค่า 1,000 ค่า:
 import numpy as np

#make this example reproducible.
n.p. random . seed ( 1 )

#create numpy array with 1000 values that follows normal dist with mean=10 and sd=2
data = np. random . normal (size= 1000 , loc= 10 , scale= 2 )

#view first five values
data[: 5 ]

array([13.24869073, 8.77648717, 8.9436565, 7.85406276, 11.73081526])
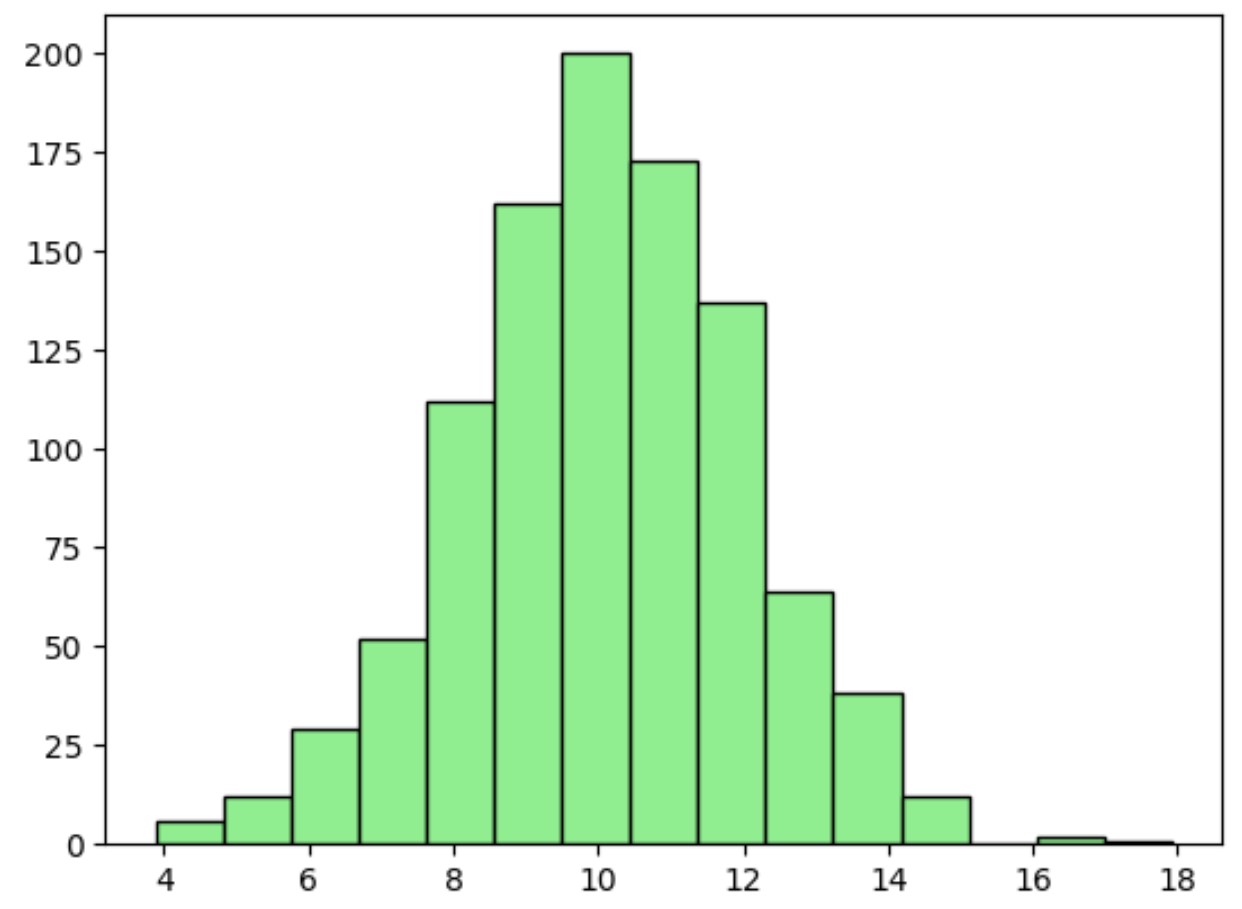
เราสามารถใช้โค้ดต่อไปนี้เพื่อสร้างฮิสโตแกรมใน Matplotlib เพื่อแสดงภาพการกระจายของค่าในอาร์เรย์ NumPy:
 import matplotlib. pyplot as plt

#create histogram
plt. hist (data, color=' lightgreen ', ec=' black ', bins= 15 )

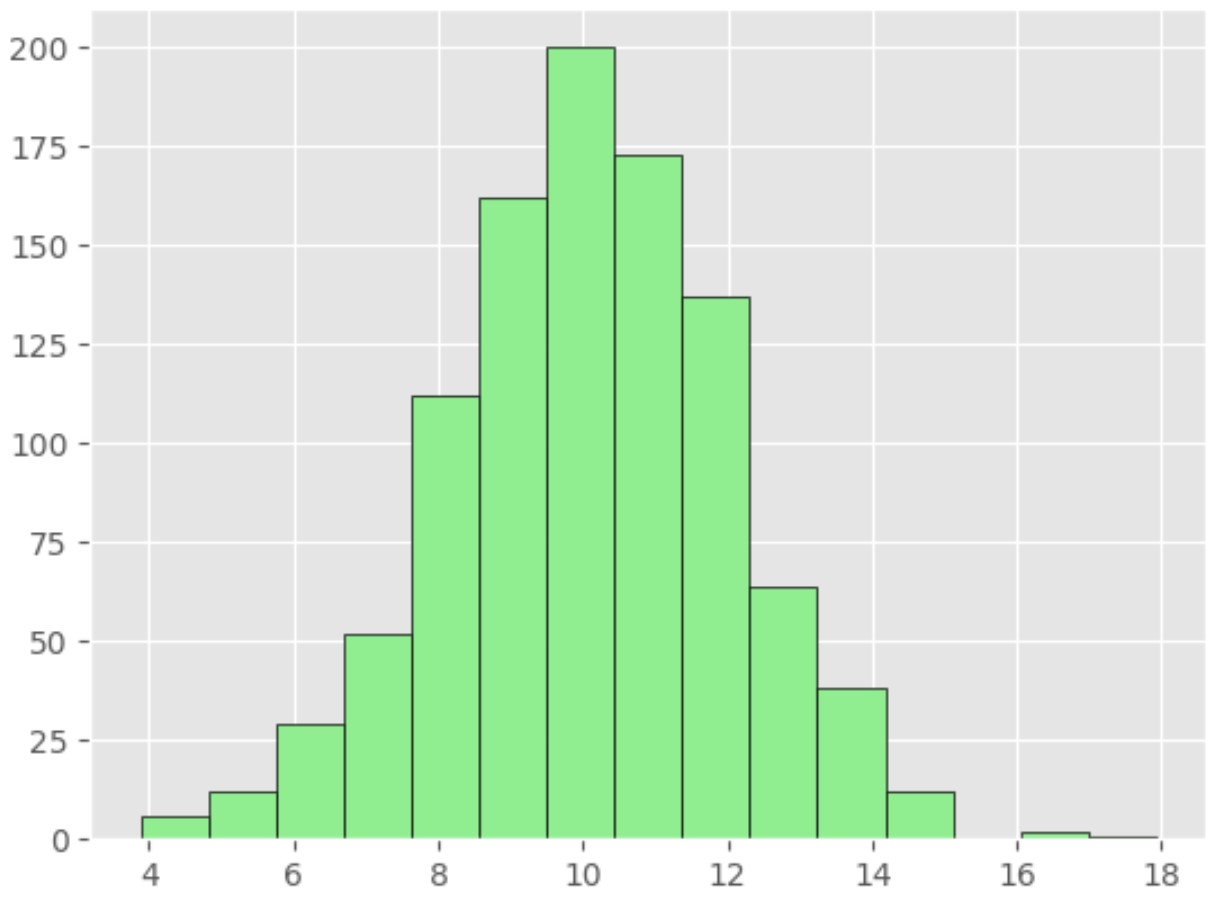
หากต้องการใช้สไตล์ ggplot2 กับฮิสโตแกรมนี้ เราสามารถใช้ plt.syle.use(‘ggplot’) ได้ดังนี้:
 import matplotlib. pyplot as plt

#specify ggplot2 style
plt. style . use (' ggplot ')

#create histogram with ggplot2 style
plt. hist (data, color=' lightgreen ', ec=' black ', bins= 15 )

ตอนนี้ฮิสโตแกรมมีสไตล์ของพล็อตที่สร้างขึ้นใน ggplot2
กล่าวคือ สไตล์นี้จะเพิ่มพื้นหลังสีเทาอ่อนพร้อมเส้นตารางสีขาว และใช้ป้ายกำกับเครื่องหมายขีดแกนที่ใหญ่กว่าเล็กน้อย
โปรดทราบว่าเราใช้สไตล์ ggplot2 กับฮิสโตแกรม แต่สามารถใช้คำสั่ง plt.style.use(‘ggplot’) เพื่อนำสไตล์ ggplot2 ไปใช้กับพล็อตใดๆ ใน Matplotlib ได้
หมายเหตุ : คุณสามารถค้นหาสไตล์ชีตอื่น ๆ ที่พร้อมใช้งานในแปลง Matplotlib ได้ที่นี่
แหล่งข้อมูลเพิ่มเติม
บทช่วยสอนต่อไปนี้จะอธิบายวิธีสร้างแผนภูมิทั่วไปอื่นๆ ใน Python:
วิธีสร้างแผนภูมิแท่งแบบเรียงซ้อนใน Matplotlib
วิธีสร้างฮิสโตแกรมความถี่สัมพัทธ์ใน Matplotlib
วิธีสร้าง barplot แนวนอนใน Seaborn