วิธีการวาดรูปสี่เหลี่ยมใน matplotlib (พร้อมตัวอย่าง)
หากต้องการวาดรูปสี่เหลี่ยมผืนผ้าใน Matplotlib คุณสามารถใช้ฟังก์ชัน matplotlib.patches.Rectangle ซึ่งใช้ไวยากรณ์ต่อไปนี้:
matplotlib.patches.Rectangle (xy, ความกว้าง, ความสูง, มุม = 0.0)
ทอง:
- xy: พิกัด (x, y) ของจุดยึดของรูปสี่เหลี่ยมผืนผ้า
- width: ความกว้างของรูปสี่เหลี่ยมผืนผ้า
- height: ความสูงของรูปสี่เหลี่ยมผืนผ้า
- มุม: การหมุนเป็นองศาทวนเข็มนาฬิการอบ xy (ค่าเริ่มต้นคือ 0)
บทช่วยสอนนี้มีตัวอย่างการใช้งานฟังก์ชันนี้ในทางปฏิบัติหลายตัวอย่าง
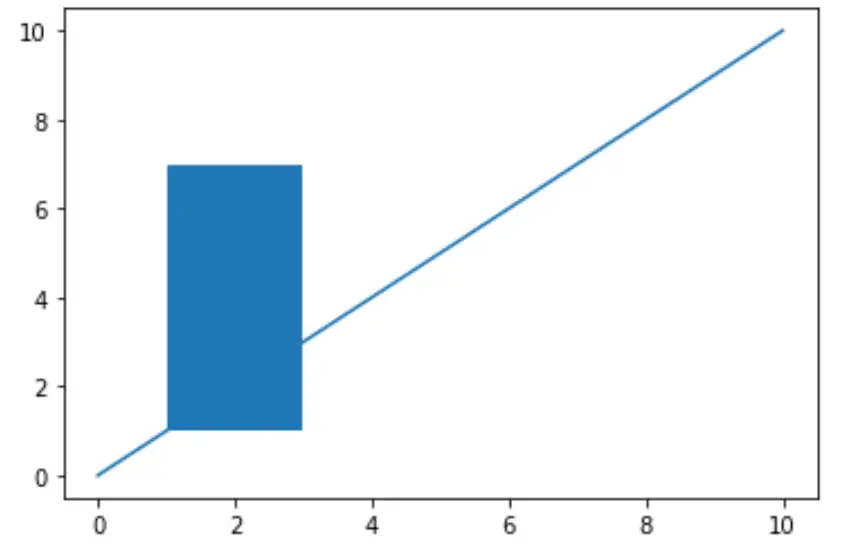
ตัวอย่างที่ 1: วาดรูปสี่เหลี่ยมผืนผ้าบนเส้นทาง
รหัสต่อไปนี้แสดงวิธีการวาดรูปสี่เหลี่ยมผืนผ้าบนพล็อต Matplotlib ที่มีความกว้าง 2 และความสูง 6:
 import matplotlib. pyplot as plt
from matplotlib. patches import Rectangle

#define Matplotlib figure and axis
fig, ax = plt. subplots ()

#create simple line plot
ax. plot ([0, 10],[0, 10])

#add rectangle to plot
ax. add_patch (Rectangle((1, 1), 2, 6))

#displayplot
plt. show ()

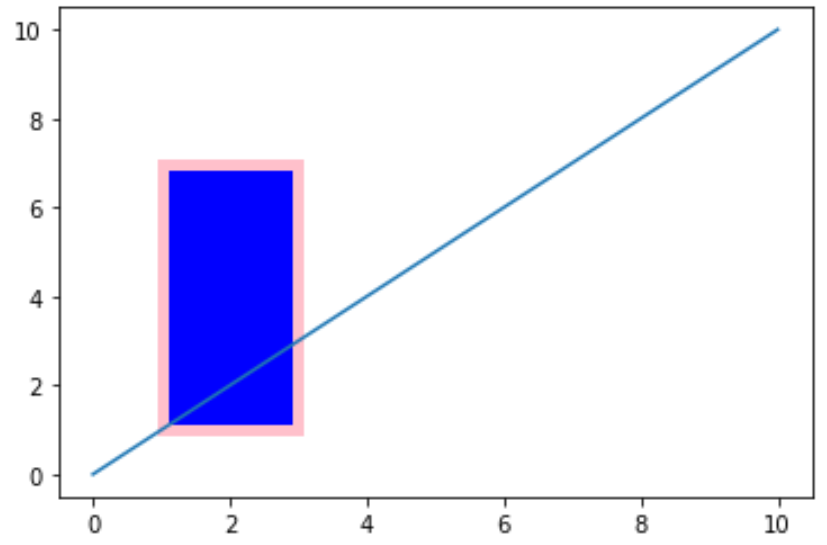
ตัวอย่างที่ 2: ตกแต่งรูปสี่เหลี่ยมผืนผ้า
รหัสต่อไปนี้แสดงวิธีการจัดรูปแบบสี่เหลี่ยมผืนผ้า:
 import matplotlib. pyplot as plt
from matplotlib. patches import Rectangle

#define Matplotlib figure and axis
fig, ax = plt. subplots ()

#create simple line plot
ax. plot ([0, 10],[0, 10])

#add rectangle to plot
ax. add_patch (Rectangle((1, 1), 2, 6,
             edgecolor = ' pink ',
             facecolor = ' blue ',
             fill= True ,
             lw= 5 ))

#displayplot
plt. show ()

คุณสามารถดูรายการคุณสมบัติสไตล์ทั้งหมดที่คุณสามารถนำไปใช้กับสี่เหลี่ยมผืนผ้า ได้ที่นี่
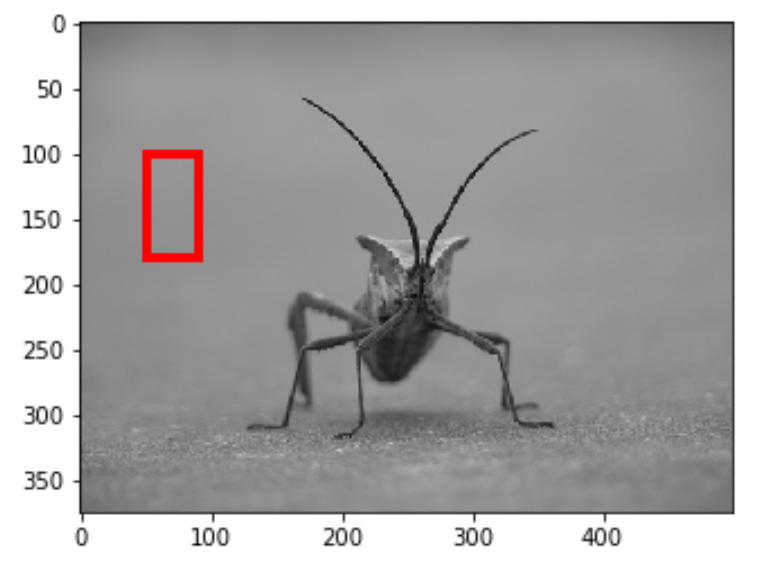
ตัวอย่างที่ 3: วาดรูปสี่เหลี่ยมผืนผ้าบนรูปภาพ
รหัสต่อไปนี้แสดงวิธีการวาดรูปสี่เหลี่ยมผืนผ้าบนรูปภาพใน Matplotilb โปรดทราบว่ารูปภาพที่ใช้ในตัวอย่างนี้มาจาก บทช่วยสอน Matplotlib นี้
หากต้องการจำลองตัวอย่างนี้ เพียงดาวน์โหลดรูปภาพเป๊กจากบทช่วยสอนนี้แล้วบันทึกลงในคอมพิวเตอร์ของคุณเอง
 import matplotlib. pyplot as plt
from matplotlib. patches import Rectangle
from PIL import Image

#display the image
plt. imshow ( Image.open (' stinkbug.png '))

#add rectangle
plt. gca (). add_patch (Rectangle((50,100),40,80,
                    edgecolor=' red ',
                    facecolor=' none ',
                    lw= 4 ))

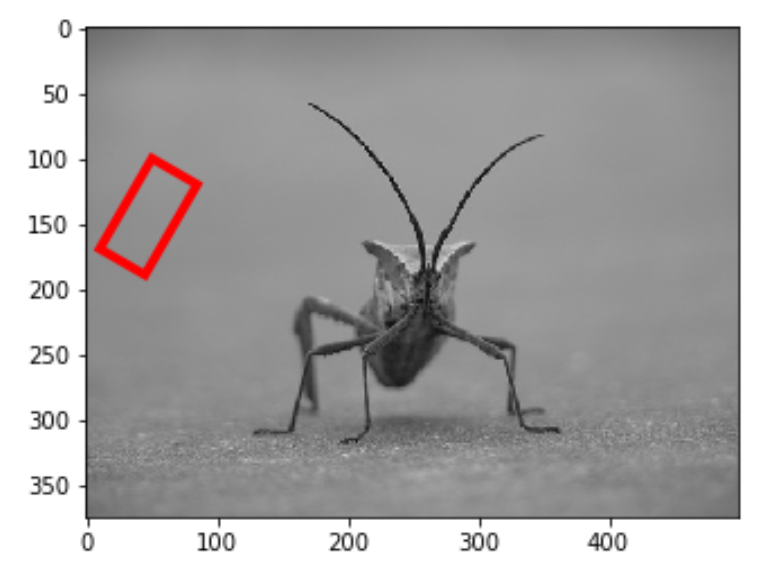
โปรดทราบว่าเราสามารถใช้อาร์กิวเมนต์ มุม เพื่อหมุนสี่เหลี่ยมตามจำนวนองศาทวนเข็มนาฬิกา:
 import matplotlib. pyplot as plt
from matplotlib. patches import Rectangle
from PIL import Image

#display the image
plt. imshow ( Image.open (' stinkbug.png '))

#add rectangle
plt. gca (). add_patch (Rectangle((50,100),40,80,
                    angle= 30 ,
                    edgecolor=' red ',
                    facecolor=' none ',
                    lw= 4 ))

ที่เกี่ยวข้อง: วิธีพล็อตวงกลมใน Matplotlib (พร้อมตัวอย่าง)