วิธีเติมพื้นที่ระหว่างบรรทัดใน matplotlib
คุณสามารถเติมพื้นที่ระหว่างค่าในพล็อต Matplotlib ได้อย่างง่ายดายโดยใช้ฟังก์ชันต่อไปนี้:
- fill_between() : เติมพื้นที่ระหว่างเส้นโค้งแนวนอนสองเส้น
- fill_betweenx() : เติมพื้นที่ระหว่างเส้นโค้งแนวตั้งสองเส้น
บทช่วยสอนนี้ให้ตัวอย่างวิธีใช้แต่ละฟังก์ชันเหล่านี้ในทางปฏิบัติ
ตัวอย่างที่ 1: เติมพื้นที่ระหว่างเส้นแนวนอนสองเส้น
รหัสต่อไปนี้แสดงวิธีการเติมพื้นที่ระหว่างเส้นแนวนอนสองเส้น:
 import matplotlib. pyplot as plt
import numpy as np

#define x and y values
x = np. arange (0,10,0.1)
y = np. arange (10,20,0.1)

#create plot of values
plt. plot (x,y)

#fill in area between the two lines
plt. fill_between (x,y,color=' red ')
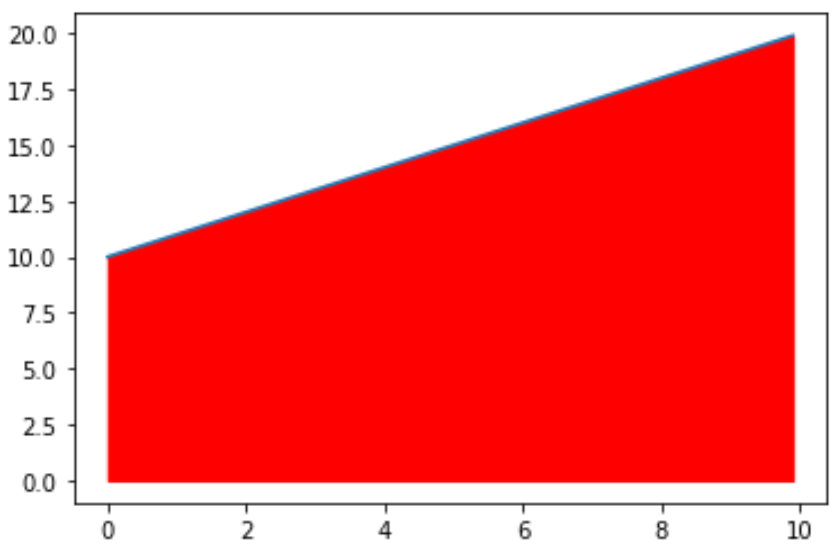
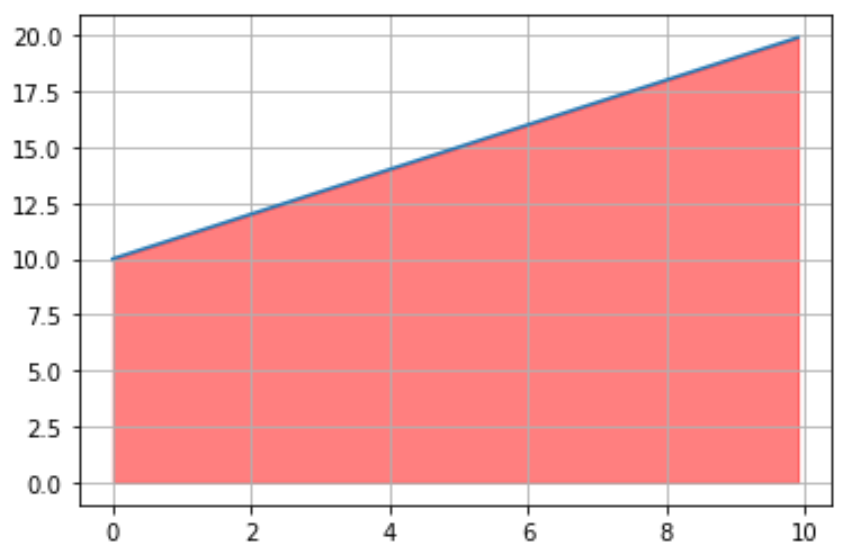
โปรดทราบว่าเรายังสามารถใช้ฟังก์ชัน plt.grid() เพื่อเพิ่มตารางลงในพล็อตเพื่อให้ดูได้ง่ายขึ้นว่าค่าใดถูกเติม:
 import matplotlib. pyplot as plt
import numpy as np

#define x and y values
x = np. arange (0,10,0.1)
y = np. arange (10,20,0.1)

#create plot of values
plt. plot (x,y)

#fill in area between the two lines
plt. fill_between (x, y, color=' red ', alpha= .5 )

#add gridlines
plt. grid ()
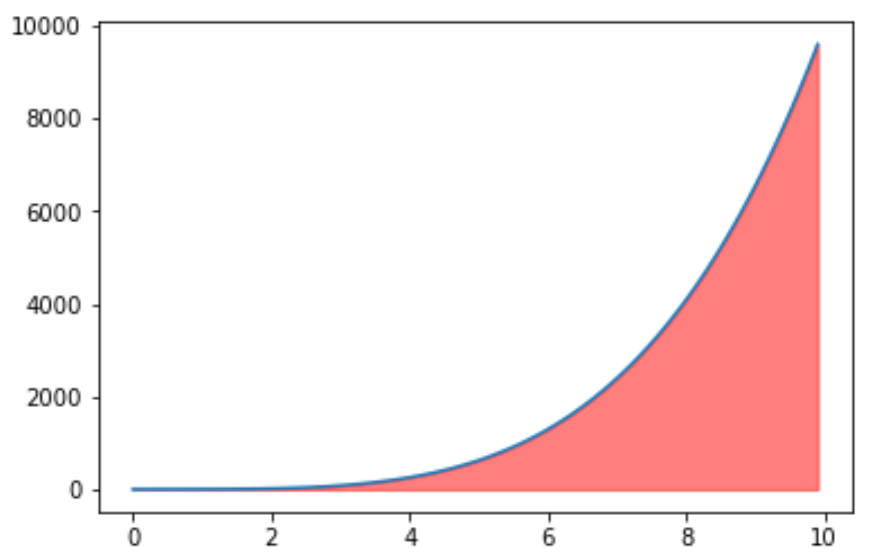
ตัวอย่างที่ 2: เติมพื้นที่ใต้เส้นโค้ง
รหัสต่อไปนี้แสดงวิธีการเติมพื้นที่ใต้เส้นโค้ง:
 import matplotlib. pyplot as plt
import numpy as np

#define x and y values
x = np. arange (0,10,0.1)
y = x**4

#create plot of values
plt. plot (x,y)

#fill in area between the two lines
plt. fill_between (x, y, color=' red ', alpha= .5 )
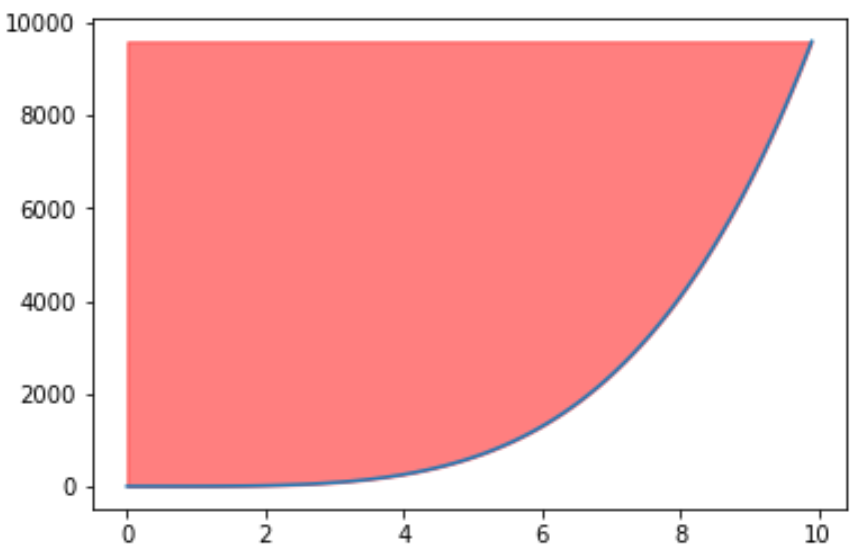
ตัวอย่างที่ 3: เติมพื้นที่เหนือเส้นโค้ง
รหัสต่อไปนี้แสดงวิธีการเติมพื้นที่เหนือเส้นโค้ง:
 import matplotlib. pyplot as plt
import numpy as np

#define x and y values
x = np. arange (0,10,0.1)
y = x**4

#create plot of values
plt. plot (x,y)

#fill in area between the two lines
plt. fill_between (x, y, np. max (y), color=' red ', alpha= .5 )
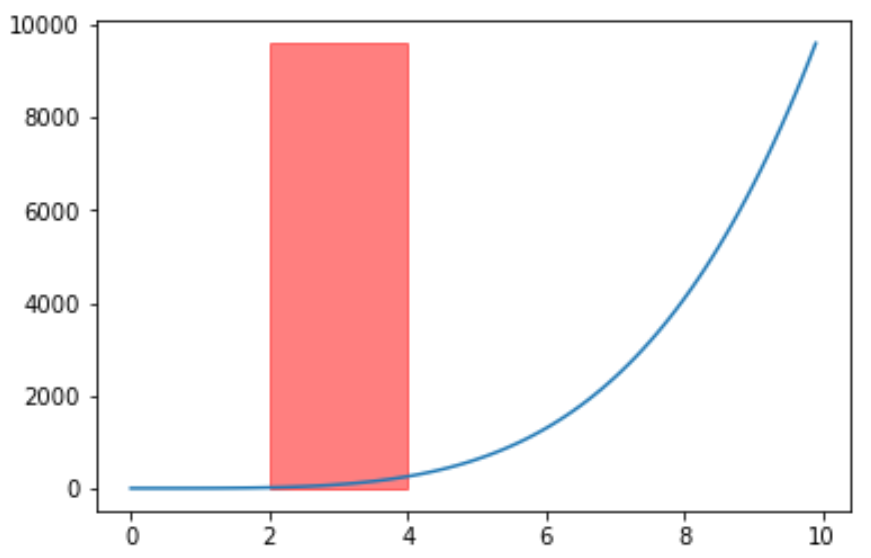
ตัวอย่างที่ 4: เติมพื้นที่ระหว่างเส้นแนวตั้งสองเส้น
รหัสต่อไปนี้แสดงวิธีการใช้ฟังก์ชัน fill_betweenx() เพื่อเติมพื้นที่ระหว่างเส้นแนวตั้งสองเส้น:
 import matplotlib. pyplot as plt
import numpy as np

#define x and y values
x = np. arange (0,10,0.1)
y = np. arange (10,20,0.1)

#create plot of values
plt. plot (x,y)

#fill in area between the two lines
plt. fill_betweenx (y, 2, 4, color=' red ', alpha= .5 )
ที่เกี่ยวข้อง: วิธีการพล็อตเส้นโค้งเรียบใน Matplotlib