วิธีการเปลี่ยนป้ายกำกับแกน boxplot ใน r (พร้อมตัวอย่าง)
คุณสามารถใช้วิธีใดๆ ต่อไปนี้เพื่อเปลี่ยนป้ายกำกับแกน X บน boxplot ใน R:
วิธีที่ 1: เปลี่ยนป้ายกำกับแกน Boxplot ใน Base R
boxplot(df, names=c(' Label 1 ', ' Label 2 ', ' Label 3 '))
วิธีที่ 2: เปลี่ยนป้ายกำกับแกน Boxplot ใน ggplot2
 levels(df_long$variable) <- c(' Label 1 ', ' Label 2 ', ' Label 3 ')

ggplot(df_long, aes(variable, value)) +
  geom_boxplot()
ตัวอย่างต่อไปนี้แสดงวิธีการใช้แต่ละวิธีในทางปฏิบัติกับกรอบข้อมูลต่อไปนี้ใน R:
 #make this example reproducible
set. seeds (0)

#create data frame
df <- data. frame (A=rnorm(1000, mean=5),
                 B=rnorm(1000, mean=10),
                 C=rnorm(1000, mean=15))

#view head of data frame
head(df)

         ABC
1 6.262954 9.713148 15.44435
2 4.673767 11.841107 15.01193
3 6.329799 9.843236 14.99072
4 6.272429 8.610197 14.69762
5 5.414641 8.526896 15.49236
6 3.460050 9.930481 14.39728
ตัวอย่างที่ 1: แก้ไขป้ายกำกับแกน boxplot ใน Base R
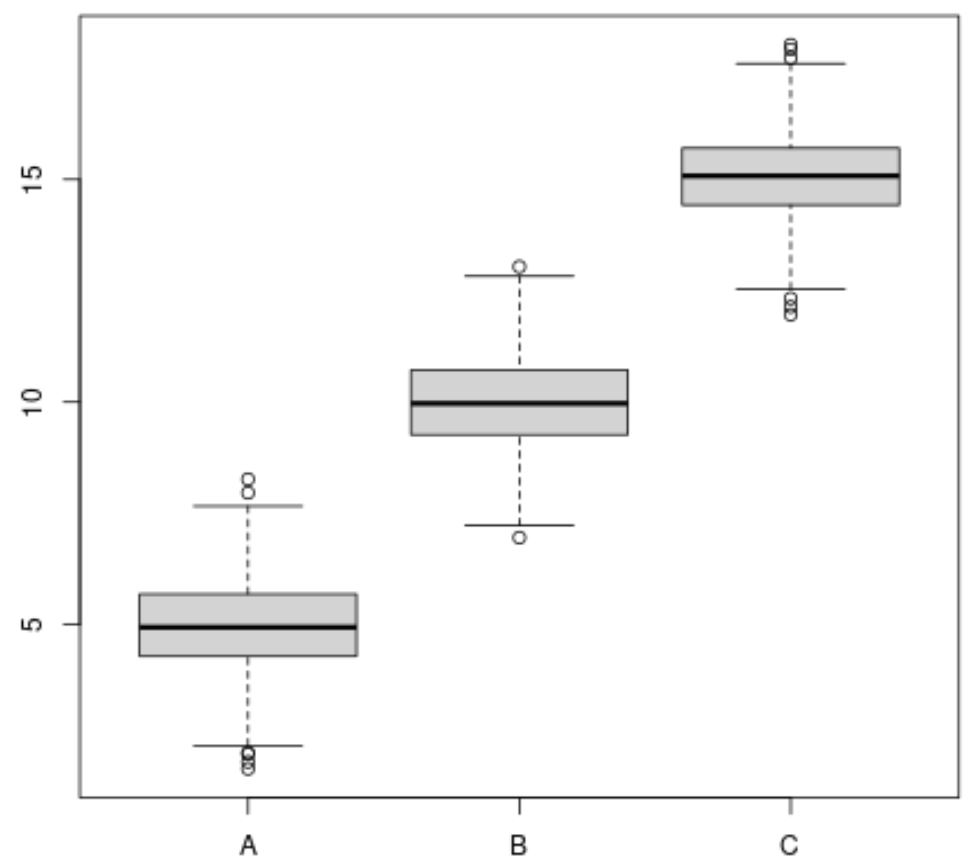
หากเราใช้ฟังก์ชัน boxplot() เพื่อสร้าง boxplot แบบ R ชื่อคอลัมน์จากกรอบข้อมูลจะถูกใช้เป็นป้ายกำกับแกน x ตามค่าเริ่มต้น:
 #create boxplots
boxplot(df)

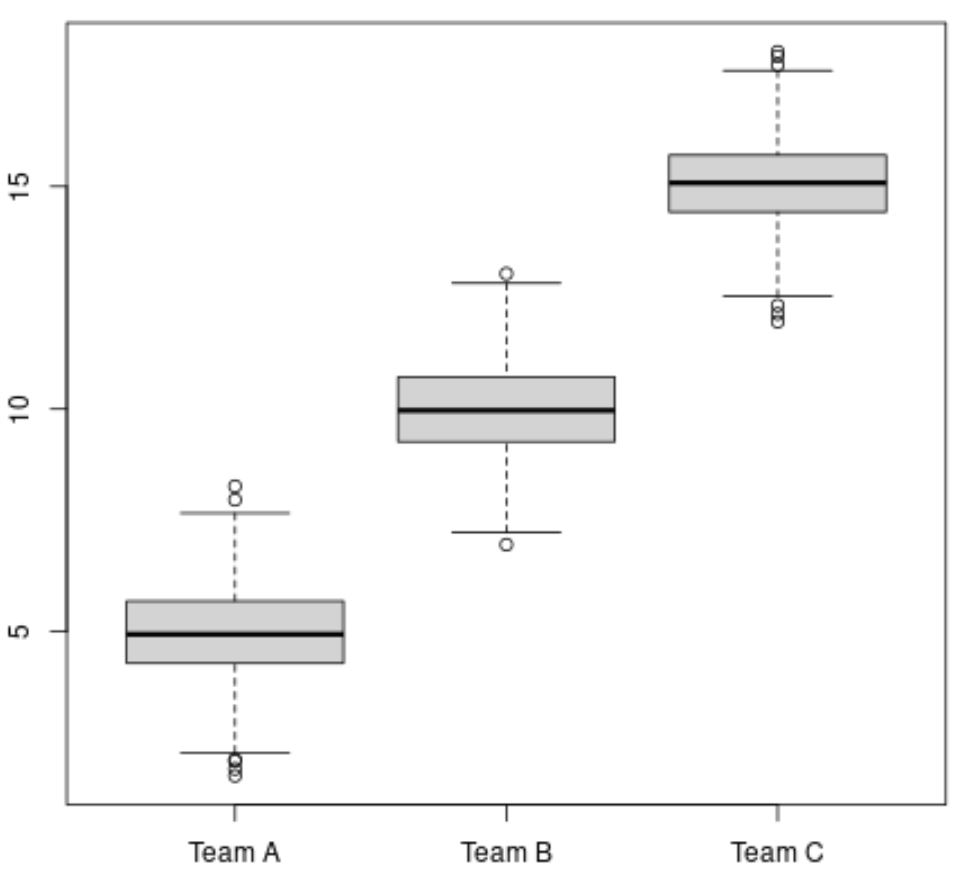
อย่างไรก็ตาม เราสามารถใช้อาร์กิวเมนต์ ชื่อ เพื่อระบุป้ายกำกับแกน x ที่จะใช้:
 #create boxplots with specific x-axis names
boxplot(df, names=c(' Team A ', ' Team B ', ' Team C '))

โปรดทราบว่าตอนนี้ป้ายกำกับที่เราระบุในอาร์กิวเมนต์ ชื่อ ถูกใช้เป็นป้ายกำกับแกน x
ตัวอย่างที่ 2: เปลี่ยนป้ายกำกับแกน Boxplot ใน ggplot2
ก่อนที่เราจะสร้าง boxplots ใน ggplot2 เราจำเป็นต้องใช้ฟังก์ชัน Melt() จากแพ็คเกจ reshape2 เพื่อ “ละลาย” กรอบข้อมูลให้อยู่ในรูปแบบยาว:
 library (reshape2)

#reshape data frame to long format
df_long <- melt(df)

#view head of long data frame
head(df_long)

  variable value
1 A 6.262954
2 A 4.673767
3 A 6.329799
4 A 6.272429
5 A 5.414641
6 A 3.460050
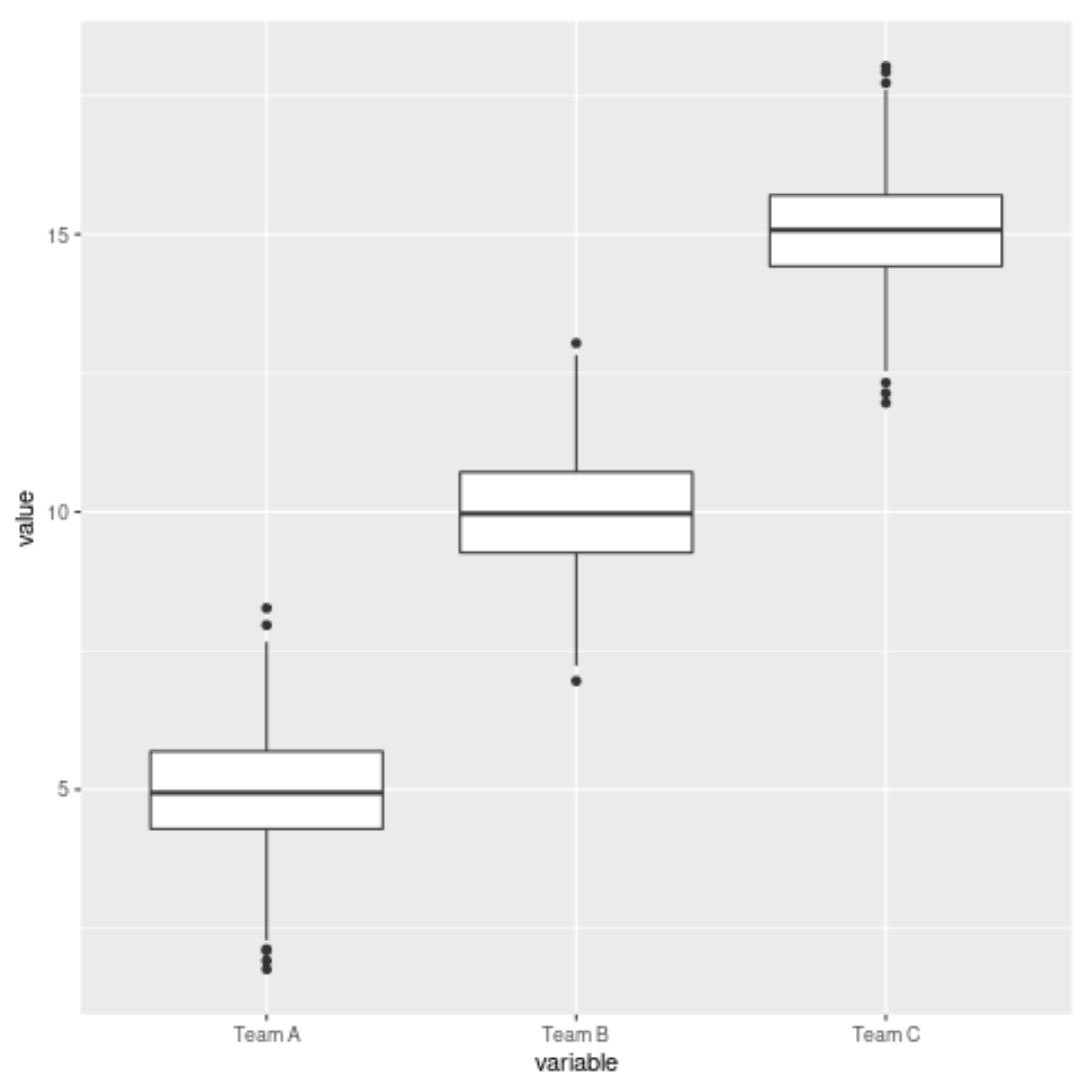
จากนั้นเราสามารถใช้ ฟังก์ชันระดับ() เพื่อระบุป้ายกำกับแกน x และฟังก์ชัน geom_boxplot() เพื่อสร้าง boxplot ใน ggplot2 ได้จริง:
 library (ggplot2)

#specify x-axis names to use
levels(df_long$variable) <- c(' Team A ', ' Team B ', ' Team C ')

#create box plot with specific x-axis labels
ggplot(df_long, aes(variable, value)) +
  geom_boxplot()

โปรดทราบว่าตอนนี้ป้ายกำกับที่เราระบุโดยใช้ฟังก์ชัน ระดับ ถูกใช้เป็นป้ายกำกับแกน X
แหล่งข้อมูลเพิ่มเติม
บทช่วยสอนต่อไปนี้จะอธิบายวิธีดำเนินการงานทั่วไปอื่นๆ ใน R:
วิธีจัดเรียง boxplots ใน R
วิธีสร้าง boxplot ที่จัดกลุ่มใน R
วิธีติดป้ายกำกับค่าผิดปกติใน boxplots ใน R
วิธีการวาด boxplots ด้วยค่าเฉลี่ยใน R