วิธีพล็อตหลายแปลงบนกราฟเดียวกันใน r (3 ตัวอย่าง)
คุณสามารถใช้วิธีการต่อไปนี้เพื่อวาดหลายแปลงบนกราฟเดียวกันใน R:
วิธีที่ 1: วาดเส้นหลายเส้นบนกราฟเดียวกัน
 #plot first line
plot(x, y1, type=' l ')

#add second line to plot
lines(x, y2)
วิธีที่ 2: สร้างหลายเส้นทางเคียงข้างกัน
 #define plotting area as one row and two columns
by(mfrow = c(1, 2))

#create first plot
plot(x, y1, type=' l ')

#create second plot
plot(x, y2, type=' l ')
วิธีที่ 3: สร้างพล็อตที่ซ้อนกันในแนวตั้งหลายรายการ
 #define plotting area as two rows and one column
by(mfrow = c(2, 1))

#create first plot
plot(x, y1, type=' l ')

#create second plot
plot(x, y2, type=' l ')
ตัวอย่างต่อไปนี้แสดงวิธีการใช้แต่ละวิธีในทางปฏิบัติ
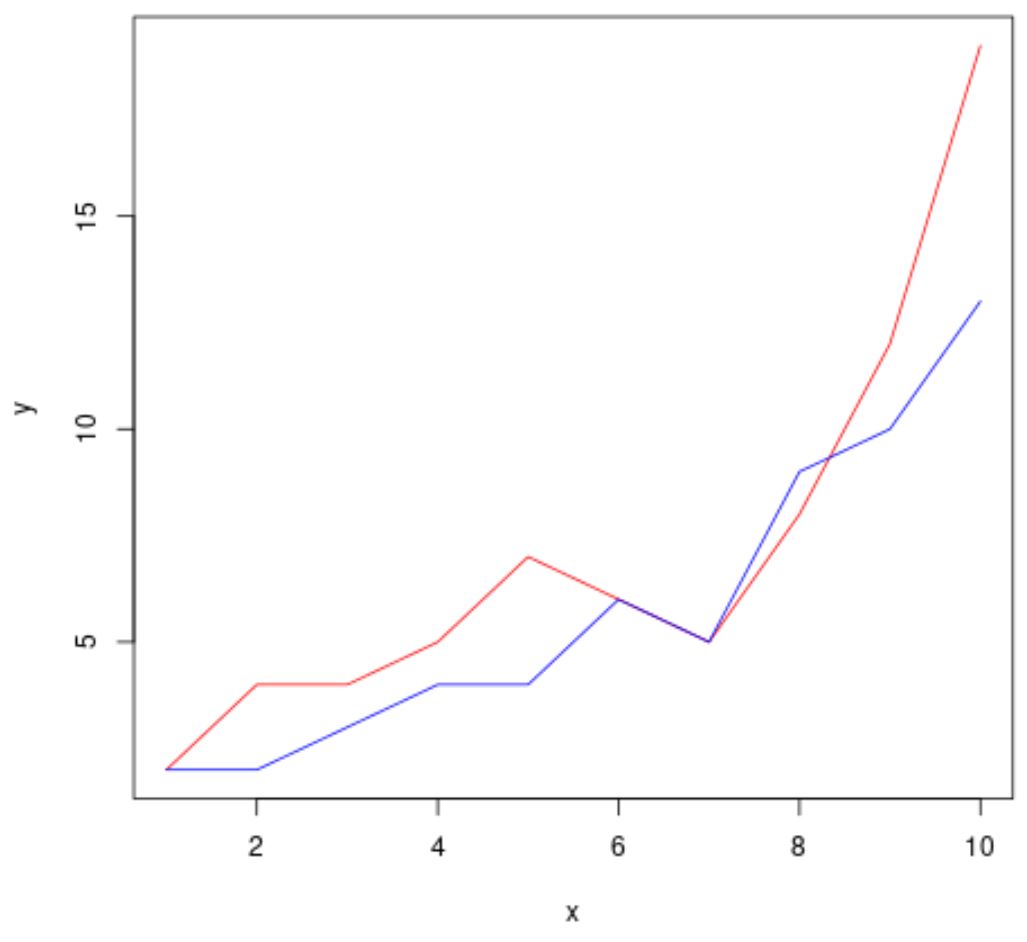
ตัวอย่างที่ 1: การวาดเส้นหลายเส้นบนกราฟเดียวกัน
รหัสต่อไปนี้แสดงวิธีการวาดเส้นสองเส้นบนกราฟเดียวกันใน R:
 #define data to plot
x <- 1:10
y1 <- c(2, 4, 4, 5, 7, 6, 5, 8, 12, 19)
y2 <- c(2, 2, 3, 4, 4, 6, 5, 9, 10, 13)

#plot first line
plot(x, y1, type=' l ', col=' red ', xlab=' x ', ylab=' y ')

#add second line to plot
lines(x, y2, col=' blue ')

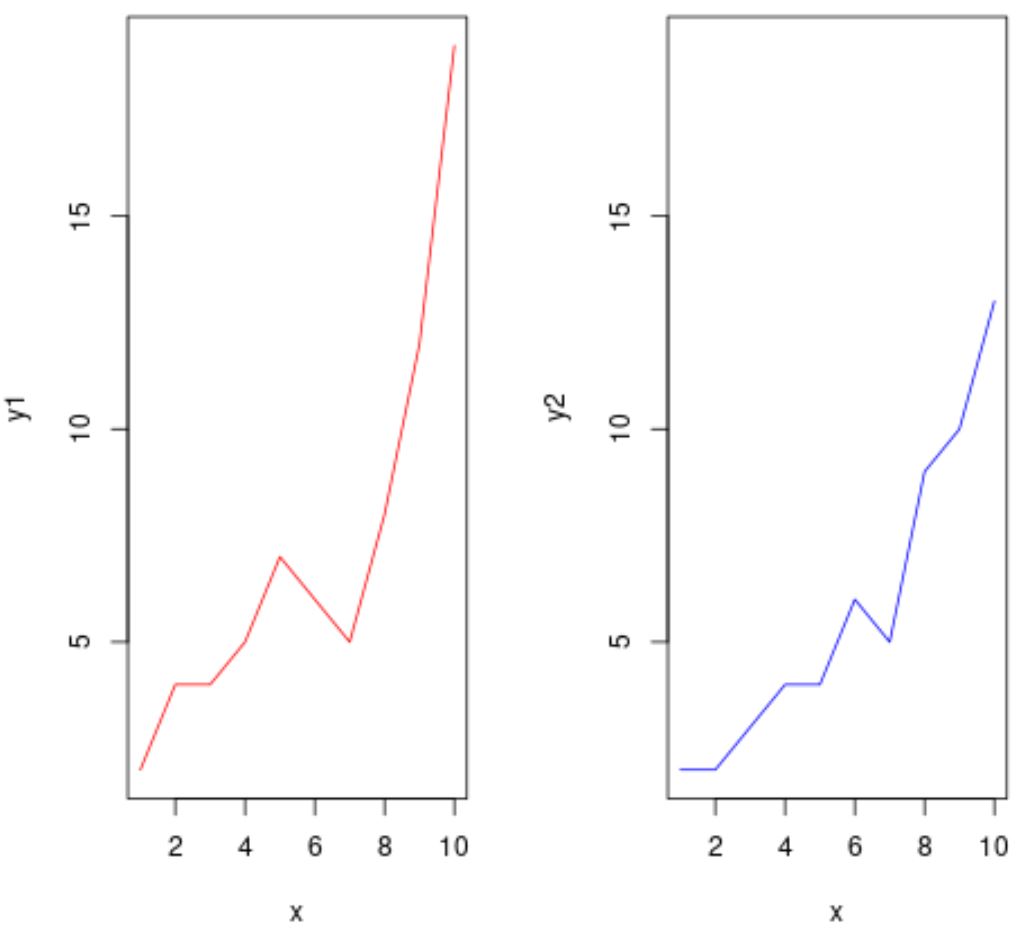
ตัวอย่างที่ 2: สร้างหลายเส้นทางเคียงข้างกัน
รหัสต่อไปนี้แสดงวิธีการใช้อาร์กิวเมนต์ par() เพื่อลงจุดหลายแปลงแบบเคียงข้างกัน:
 #define data to plot
x <- 1:10
y1 <- c(2, 4, 4, 5, 7, 6, 5, 8, 12, 19)
y2 <- c(2, 2, 3, 4, 4, 6, 5, 9, 10, 13)

#define plotting area as one row and two columns
by(mfrow = c(1, 2))

#create first line plot
plot(x, y1, type=' l ', col=' red ')

#create second line plot
plot(x, y2, type=' l ', col=' blue ', ylim=c(min(y1), max(y1)))

โปรดทราบว่าเราใช้อาร์กิวเมนต์ ylim() ในพล็อตที่สองเพื่อให้แน่ใจว่าทั้งสองพล็อตมีขีดจำกัดเท่ากันบนแกน y
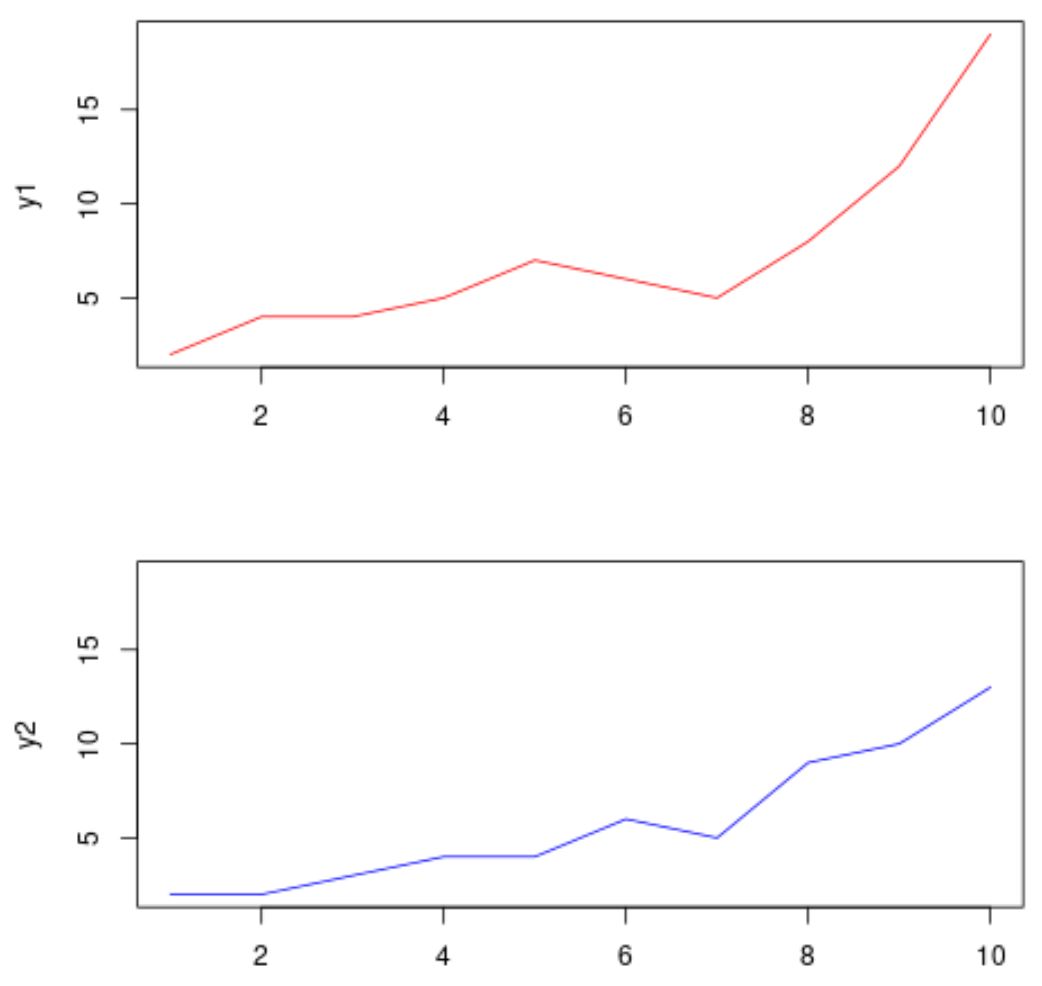
ตัวอย่างที่ 3: สร้างแปลงที่ซ้อนกันในแนวตั้งหลายรายการ
รหัสต่อไปนี้แสดงวิธีการใช้อาร์กิวเมนต์ par() เพื่อลงจุดหลายแปลงที่ซ้อนกันในแนวตั้ง:
 #define data to plot
x <- 1:10
y1 <- c(2, 4, 4, 5, 7, 6, 5, 8, 12, 19)
y2 <- c(2, 2, 3, 4, 4, 6, 5, 9, 10, 13)

#define plotting area as two rows and one column
par(mfrow = c(2, 1), mar = c(2, 4, 4, 2))
#create first line plot
plot(x, y1, type=' l ', col=' red ')

#create second line plot
plot(x, y2, type=' l ', col=' blue ', ylim=c(min(y1), max(y1)))

โปรดทราบว่าเราใช้อาร์กิวเมนต์ mar เพื่อระบุระยะขอบ (ล่าง, ซ้าย, บน, ขวา) ของพื้นที่ลงจุด
หมายเหตุ: ค่าเริ่มต้นคือ mar = c(5.1, 4.1, 4.1, 2.1)
แหล่งข้อมูลเพิ่มเติม
บทช่วยสอนต่อไปนี้จะอธิบายวิธีดำเนินการงานทั่วไปอื่นๆ ใน R:
วิธีพล็อตหลายคอลัมน์ใน R
วิธีวาดตำนานนอกโครงเรื่องใน R
วิธีสร้างพล็อตล็อกล็อกใน R