วิธีซ่อนแกนใน matplotlib (พร้อมตัวอย่าง)
คุณสามารถใช้ไวยากรณ์ต่อไปนี้เพื่อซ่อนแกนในแปลง Matplotlib:
 import matplotlib. pyplot as plt

#get current axes
ax = plt. gca ()

#hide x-axis
ax. get_xaxis (). set_visible ( False )

#hide y-axis
ax. get_yaxis (). set_visible ( False )
ตัวอย่างต่อไปนี้แสดงวิธีใช้ไวยากรณ์นี้ในทางปฏิบัติ
ตัวอย่างที่ 1: ซ่อนแกน X
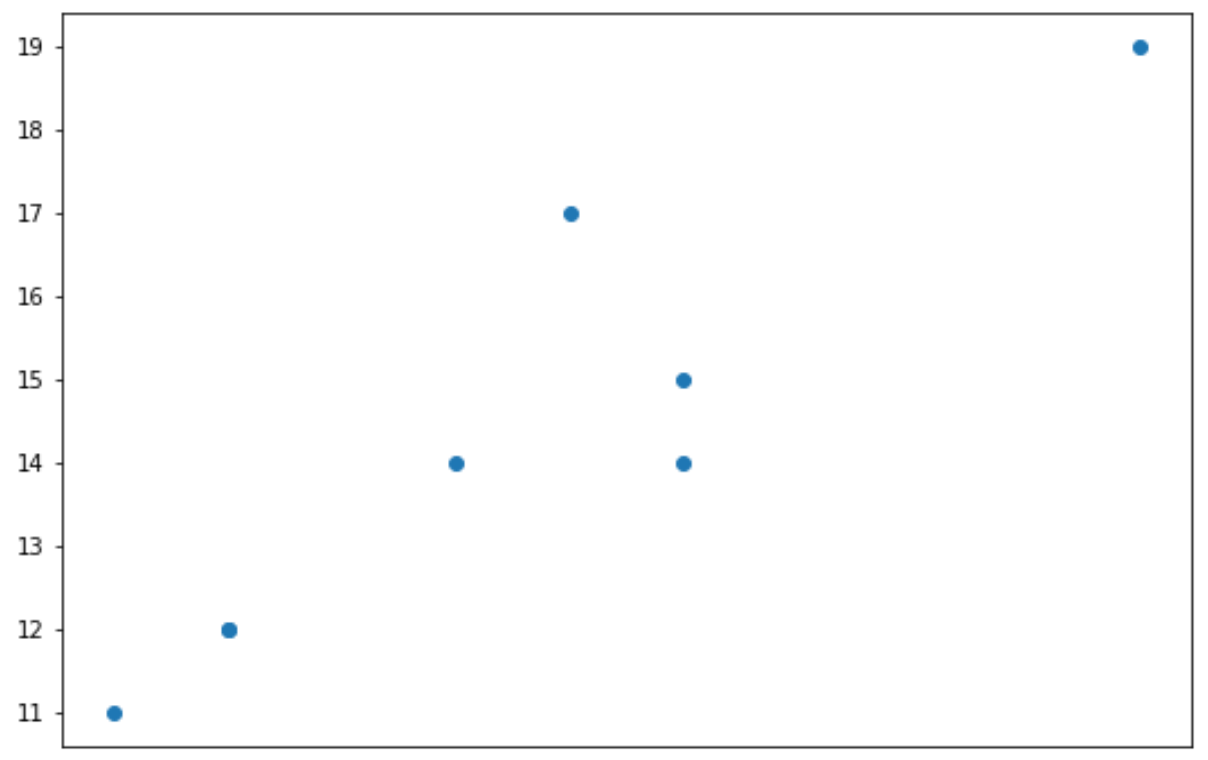
รหัสต่อไปนี้แสดงวิธีการสร้าง Scatterplot และซ่อนแกน X:
 import matplotlib. pyplot as plt

#define data
x = [3, 4, 4, 6, 7, 8, 8, 12]
y = [11, 12, 12, 14, 17, 15, 14, 19]

#create scatterplot
plt. scatter (x,y)

#get current axes
ax = plt. gca ()

#hide x-axis
ax. get_xaxis (). set_visible ( False )
ตัวอย่างที่ 2: ซ่อนแกน Y
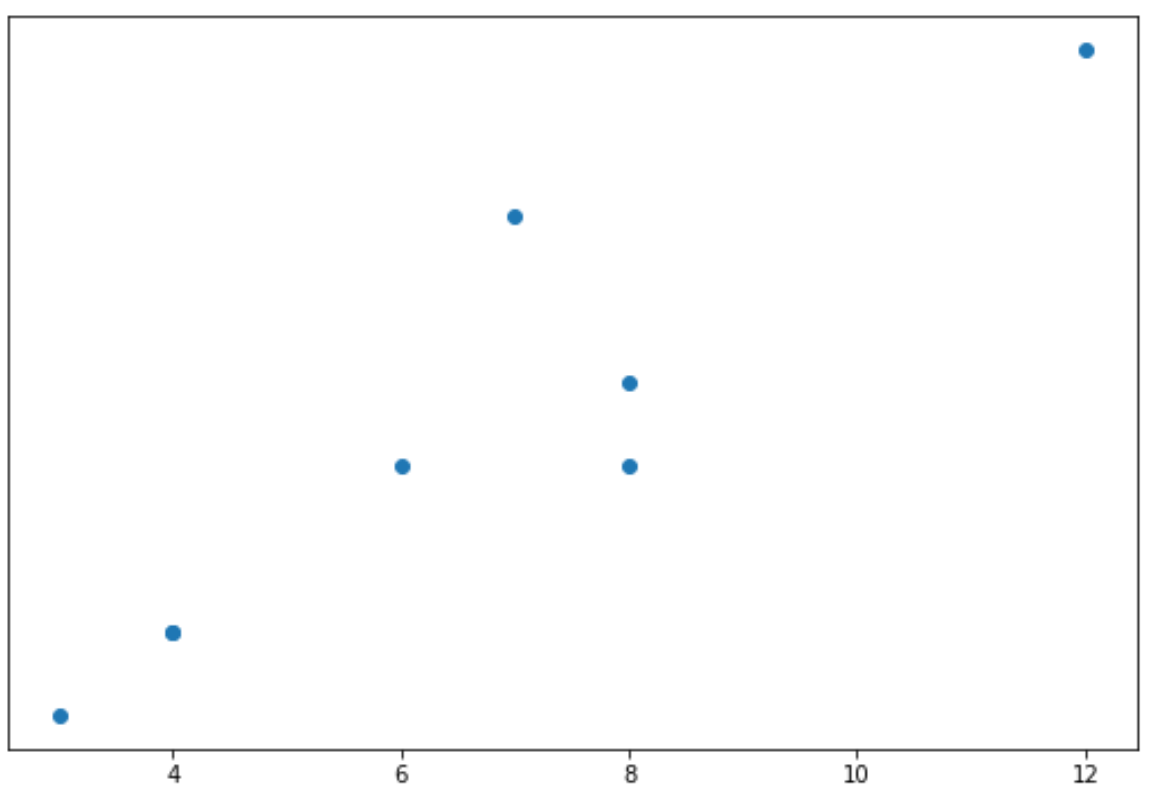
รหัสต่อไปนี้แสดงวิธีการสร้าง Scatterplot และซ่อนแกน Y:
 import matplotlib. pyplot as plt

#define data
x = [3, 4, 4, 6, 7, 8, 8, 12]
y = [11, 12, 12, 14, 17, 15, 14, 19]

#create scatterplot
plt. scatter (x,y)

#get current axes
ax = plt. gca ()

#hide y-axis
ax. get_yaxis (). set_visible ( False )
ตัวอย่างที่ 3: ซ่อนแกนทั้งสอง
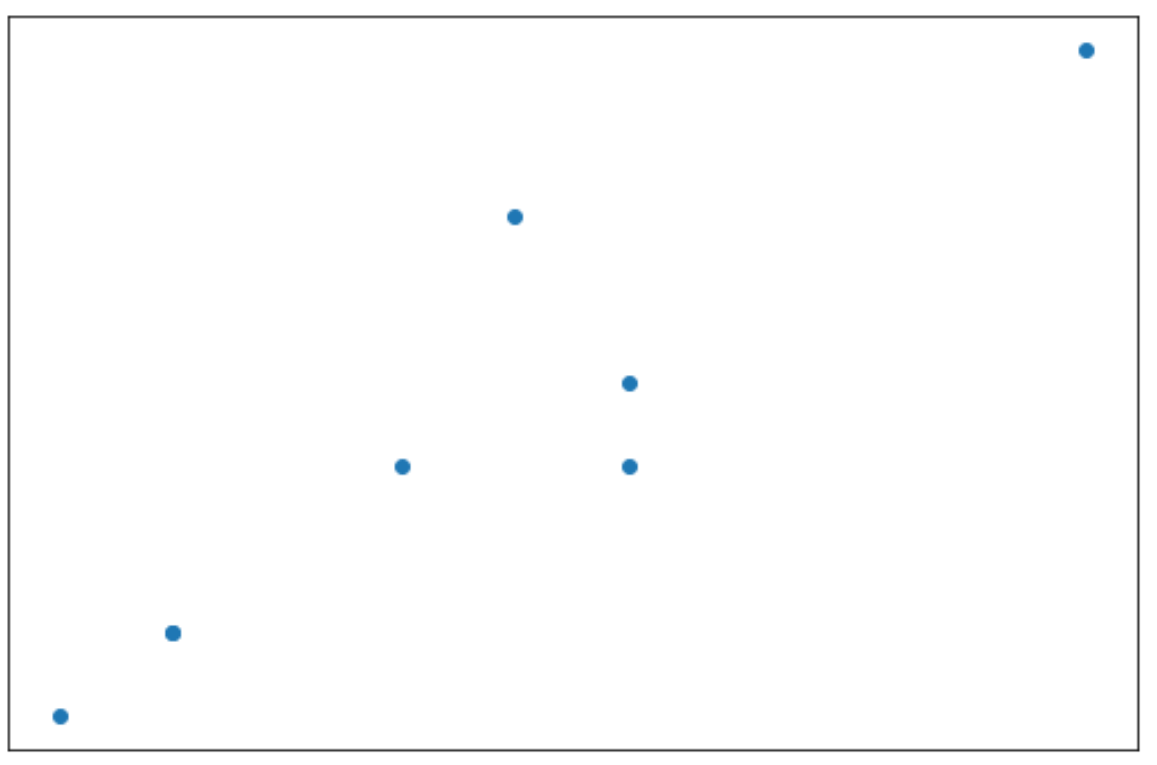
รหัสต่อไปนี้แสดงวิธีการสร้างทั้ง Scatterplot และซ่อนแกน:
 import matplotlib. pyplot as plt

#define data
x = [3, 4, 4, 6, 7, 8, 8, 12]
y = [11, 12, 12, 14, 17, 15, 14, 19]

#create scatterplot
plt. scatter (x,y)

#get current axes
ax = plt. gca ()

#hide x-axis
ax. get_xaxis (). set_visible ( False )

#hide y-axis
ax. get_yaxis (). set_visible ( False )
ตัวอย่างที่ 4: ลบแกนและเส้นขอบออกโดยสิ้นเชิง
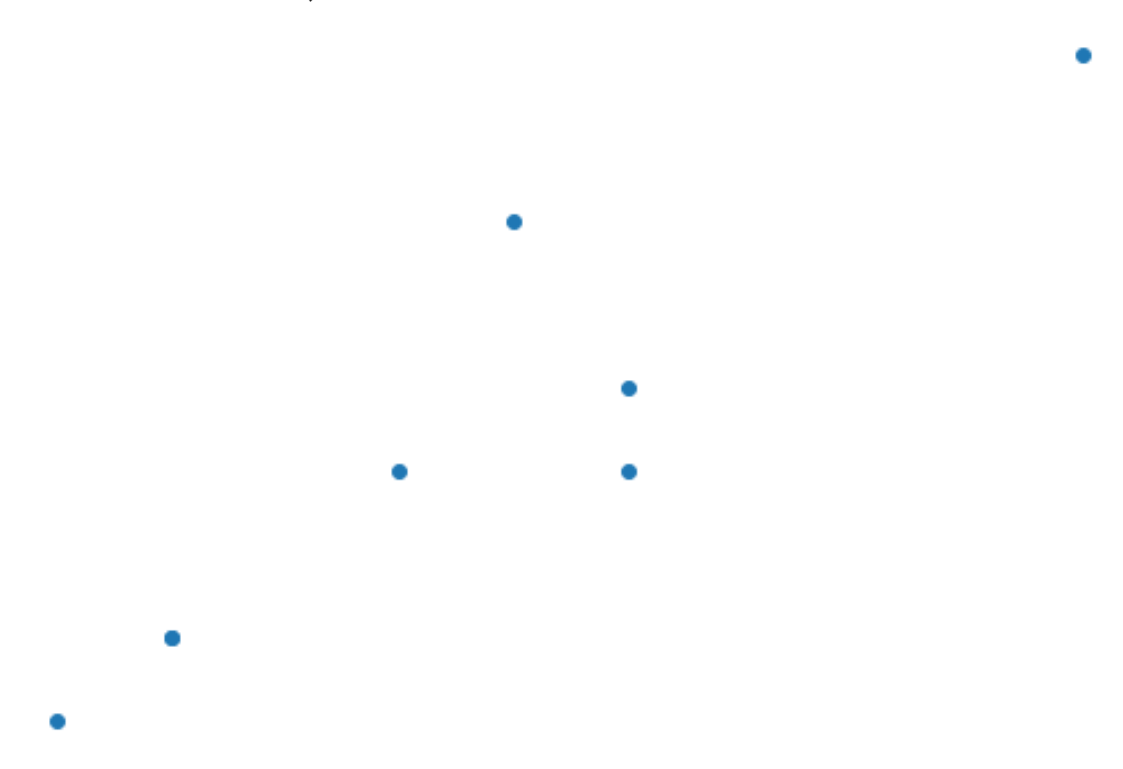
รหัสต่อไปนี้แสดงวิธีการลบแกนและเส้นขอบออกจากพล็อตโดยสมบูรณ์:
 import matplotlib. pyplot as plt

#define data
x = [3, 4, 4, 6, 7, 8, 8, 12]
y = [11, 12, 12, 14, 17, 15, 14, 19]

#create scatterplot
plt. scatter (x,y)

#get current axes
ax = plt. gca ()

#hide axes and borders
plt. axis (' off ')
แหล่งข้อมูลเพิ่มเติม
วิธีเปลี่ยนจำนวนเห็บใน Matplotlib
วิธีหมุนป้ายกำกับเครื่องหมายถูกใน Matplotlib
วิธีการตั้งค่าช่วงแกนใน Matplotlib
เกี่ยวกับผู้แต่ง
ดร.เบนจามิน แอนเดอร์สัน
สวัสดี ฉันชื่อเบนจามิน ศาสตราจารย์สถิติเกษียณอายุแล้ว และผันตัวมาเป็นครูสอนสถิติโดยเฉพาะ ด้วยประสบการณ์และความเชี่ยวชาญที่กว้างขวางในสาขาสถิติ ฉันกระตือรือร้นที่จะแบ่งปันความรู้ของฉันเพื่อเสริมศักยภาพนักเรียนผ่าน Statorials. รู้เพิ่มเติม