Curve fitting ใน python (พร้อมตัวอย่าง)
บ่อยครั้งที่คุณอาจต้องการปรับเส้นโค้งให้พอดีกับชุดข้อมูลใน Python

ตัวอย่างทีละขั้นตอนต่อไปนี้จะอธิบายวิธีจัดเส้นโค้งให้พอดีกับข้อมูลใน Python โดยใช้ฟังก์ชัน numpy.polyfit() และวิธีการกำหนดว่าเส้นโค้งใดที่เหมาะกับข้อมูลมากที่สุด
ขั้นตอนที่ 1: สร้างและแสดงภาพข้อมูล
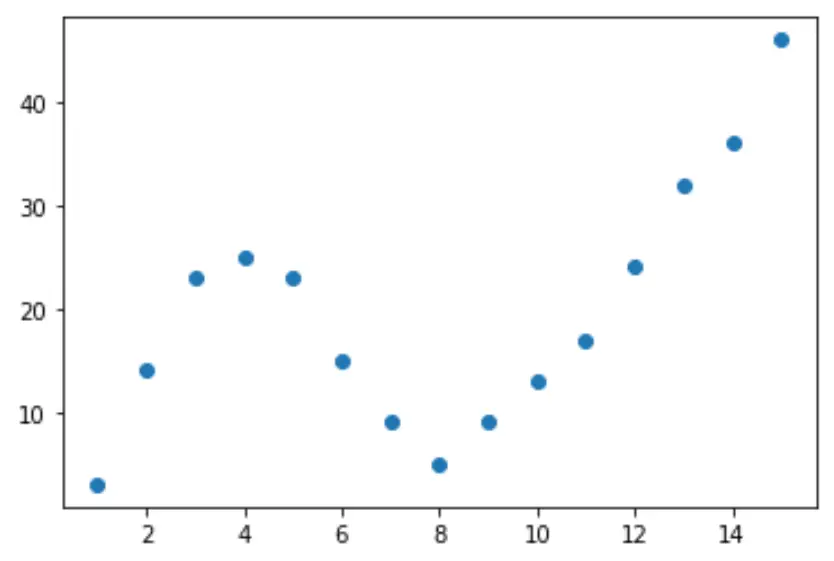
เริ่มต้นด้วยการสร้างชุดข้อมูลปลอม จากนั้นสร้าง Scatterplot เพื่อแสดงภาพข้อมูล:
 import pandas as pd
import matplotlib. pyplot as plt

#createDataFrame
df = pd. DataFrame ({' x ': [1, 2, 3, 4, 5, 6, 7, 8, 9, 10, 11, 12, 13, 14, 15],
                   ' y ': [3, 14, 23, 25, 23, 15, 9, 5, 9, 13, 17, 24, 32, 36, 46]})

#create scatterplot of x vs. y
plt. scatter (df. x , df. y )

ขั้นตอนที่ 2: ปรับหลายเส้นโค้ง
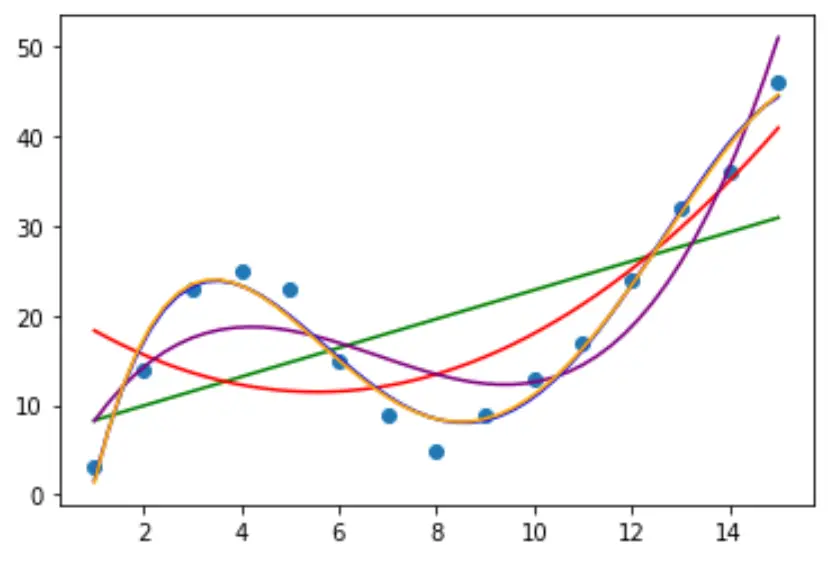
จากนั้นลองใส่โมเดลการถดถอยพหุนามหลายตัวเข้ากับข้อมูลและแสดงภาพเส้นโค้งของแต่ละโมเดลในพล็อตเดียวกัน:
 import numpy as np

#fit polynomial models up to degree 5
model1 = np. poly1d (np. polyfit (df. x , df. y , 1))
model2 = np. poly1d (np. polyfit (df. x , df. y , 2))
model3 = np. poly1d (np. polyfit (df. x , df. y , 3))
model4 = np. poly1d (np. polyfit (df. x , df. y , 4))
model5 = np. poly1d (np. polyfit (df. x , df. y , 5))

#create scatterplot
polyline = np. linspace (1, 15, 50)
plt. scatter (df. x , df. y )

#add fitted polynomial lines to scatterplot
plt. plot (polyline, model1(polyline), color=' green ')
plt. plot (polyline, model2(polyline), color=' red ')
plt. plot (polyline, model3(polyline), color=' purple ')
plt. plot (polyline, model4(polyline), color=' blue ')
plt. plot (polyline, model5(polyline), color=' orange ')
plt. show ()

เพื่อพิจารณาว่าเส้นโค้งใดที่เหมาะกับข้อมูลมากที่สุด เราสามารถดูค่า R Square ที่ปรับแล้ว ของแต่ละรุ่นได้
ค่านี้บอกเราถึงเปอร์เซ็นต์ของการแปรผันในตัวแปรตอบสนองที่สามารถอธิบายได้ด้วยตัวแปรทำนายในแบบจำลอง ปรับตามจำนวนตัวแปรทำนาย
 #define function to calculate adjusted r-squared
def adjR(x, y, degree):
    results = {}
    coeffs = np. polyfit (x, y, degree)
    p = np. poly1d (coeffs)
    yhat = p(x)
    ybar = np. sum (y)/len(y)
    ssreg = np. sum ((yhat-ybar)**2)
    sstot = np. sum ((y - ybar)**2)
    results[' r_squared '] = 1- (((1-(ssreg/sstot))*(len(y)-1))/(len(y)-degree-1))

    return results

#calculated adjusted R-squared of each model
adjR(df. x , df. y , 1)
adjR(df. x , df. y , 2)
adjR(df. x , df. y , 3)
adjR(df. x , df. y , 4)
adjR(df. x , df. y , 5)

{'r_squared': 0.3144819}
{'r_squared': 0.5186706}
{'r_squared': 0.7842864}
{'r_squared': 0.9590276}
{'r_squared': 0.9549709}
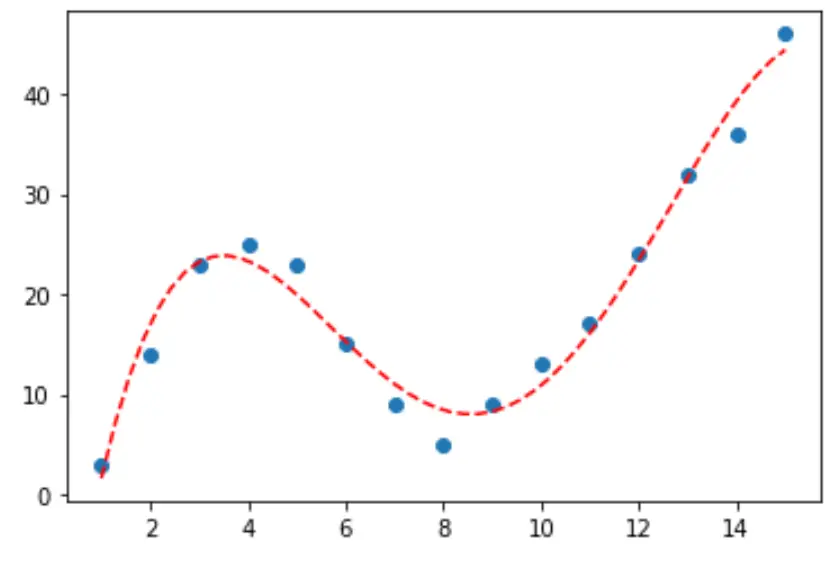
จากผลลัพธ์ เราจะเห็นว่าแบบจำลองที่มี R-squared ที่ปรับสูงสุดคือพหุนามดีกรีที่ 4 ซึ่งมี R-squared ที่ปรับแล้วเป็น 0.959
ขั้นตอนที่ 3: เห็นภาพเส้นโค้งสุดท้าย
สุดท้ายนี้ เราสามารถสร้างพล็อตกระจายด้วยเส้นโค้งของแบบจำลองพหุนามดีกรีที่ 4 ได้:
 #fit fourth-degree polynomial
model4 = np. poly1d (np. polyfit (df. x , df. y , 4))

#define scatterplot
polyline = np. linspace (1, 15, 50)
plt. scatter (df. x , df. y )

#add fitted polynomial curve to scatterplot
plt. plot (polyline, model4(polyline), ' -- ', color=' red ')
plt. show ()

เรายังสามารถรับสมการของบรรทัดนี้ได้โดยใช้ฟังก์ชัน print() :
 print (model4)

          4 3 2
-0.01924x + 0.7081x - 8.365x + 35.82x - 26.52
สมการของเส้นโค้งมีดังนี้:
y = -0.01924x 4 + 0.7081x 3 – 8.365x 2 + 35.82x – 26.52
เราสามารถใช้สมการนี้เพื่อทำนายค่าของ ตัวแปรตอบสนอง ตามตัวแปรทำนายในแบบจำลอง ตัวอย่างเช่น ถ้า x = 4 เราก็จะทำนายว่า y = 23.32 :
y = -0.0192(4) 4 + 0.7081(4) 3 – 8.365(4) 2 + 35.82(4) – 26.52 = 23.32
แหล่งข้อมูลเพิ่มเติม
ความรู้เบื้องต้นเกี่ยวกับการถดถอยพหุนาม
วิธีดำเนินการถดถอยพหุนามใน Python