วิธีสร้าง bell curve ใน python
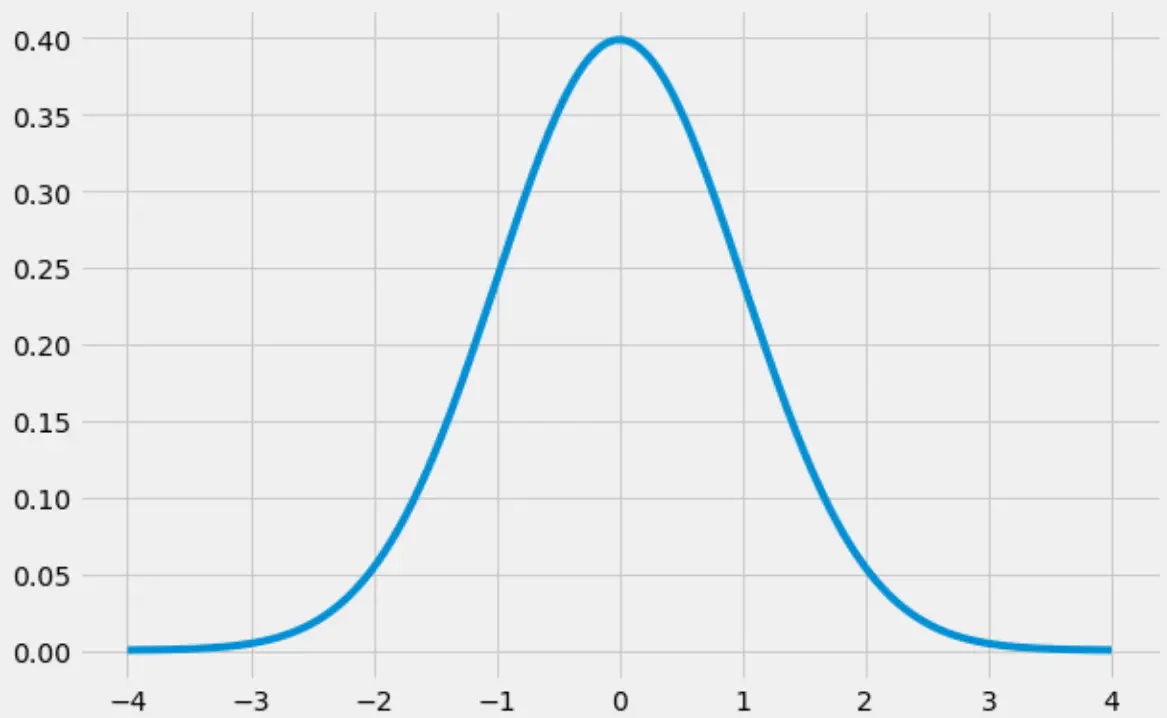
“เส้นโค้งระฆัง” คือชื่อเล่นที่ตั้งให้กับรูปร่างของ การแจกแจงแบบปกติ ซึ่งมีรูปร่าง “ระฆัง” ที่แตกต่างกัน:
บทช่วยสอนนี้จะอธิบายวิธีสร้างเส้นโค้งระฆังใน Python
วิธีสร้าง Bell Curve ใน Python
รหัสต่อไปนี้แสดงวิธีสร้างเส้นโค้งระฆังโดยใช้ไลบรารี numpy , scipy และ matplotlib :
 import numpy as np
import matplotlib.pyplot as plt
from scipy.stats import norm

#create range of x-values from -4 to 4 in increments of .001
x = np.arange(-4, 4, 0.001)

#create range of y-values that correspond to normal pdf with mean=0 and sd=1
y = norm.pdf(x,0,1)

#defineplot
fig, ax = plt.subplots(figsize=(9,6))
ax.plot(x,y)

#choose plot style and display the bell curve
plt.style.use('fivethirtyeight')
plt.show()
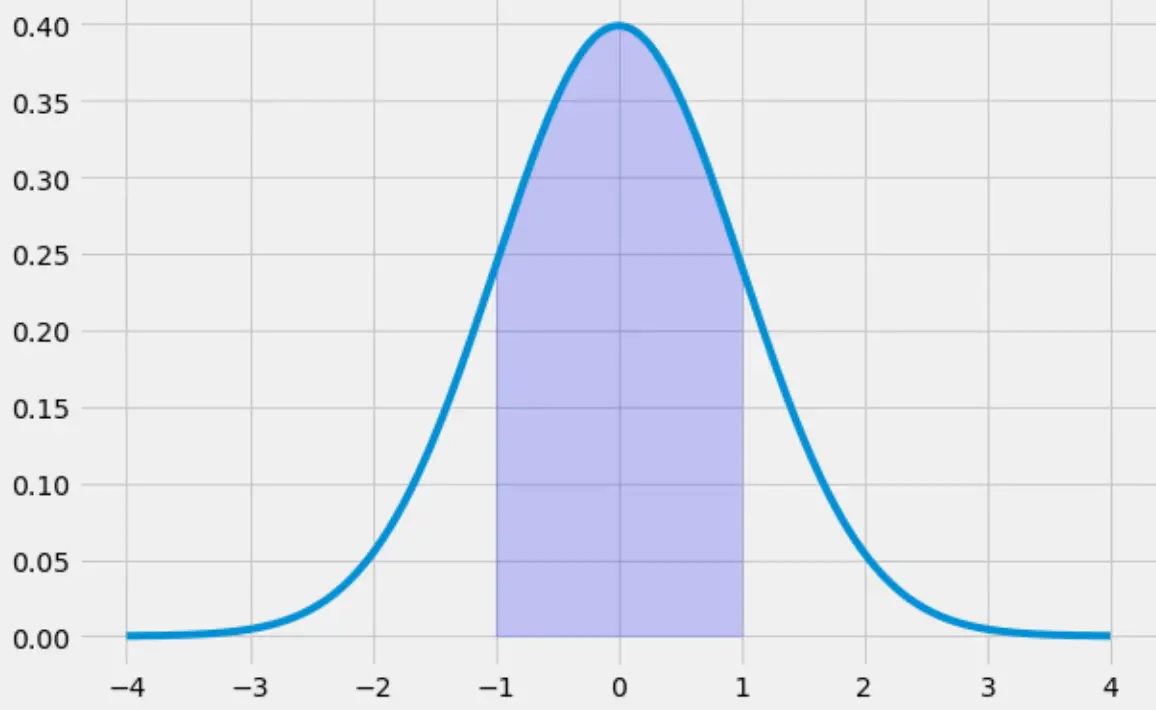
วิธีเติม Bell Curve ใน Python
รหัสต่อไปนี้แสดงวิธีการเติมพื้นที่ใต้เส้นโค้งระฆังตั้งแต่ -1 ถึง 1:
 x = np.arange(-4, 4, 0.001)
y = norm.pdf(x,0,1)

fig, ax = plt.subplots(figsize=(9,6))
ax.plot(x,y)

#specify the region of the bell curve to fill in
x_fill = np.arange(-1, 1, 0.001)
y_fill = norm.pdf(x_fill,0,1)
ax.fill_between(x_fill,y_fill,0, alpha=0.2, color='blue')

plt.style.use('fivethirtyeight')
plt.show()
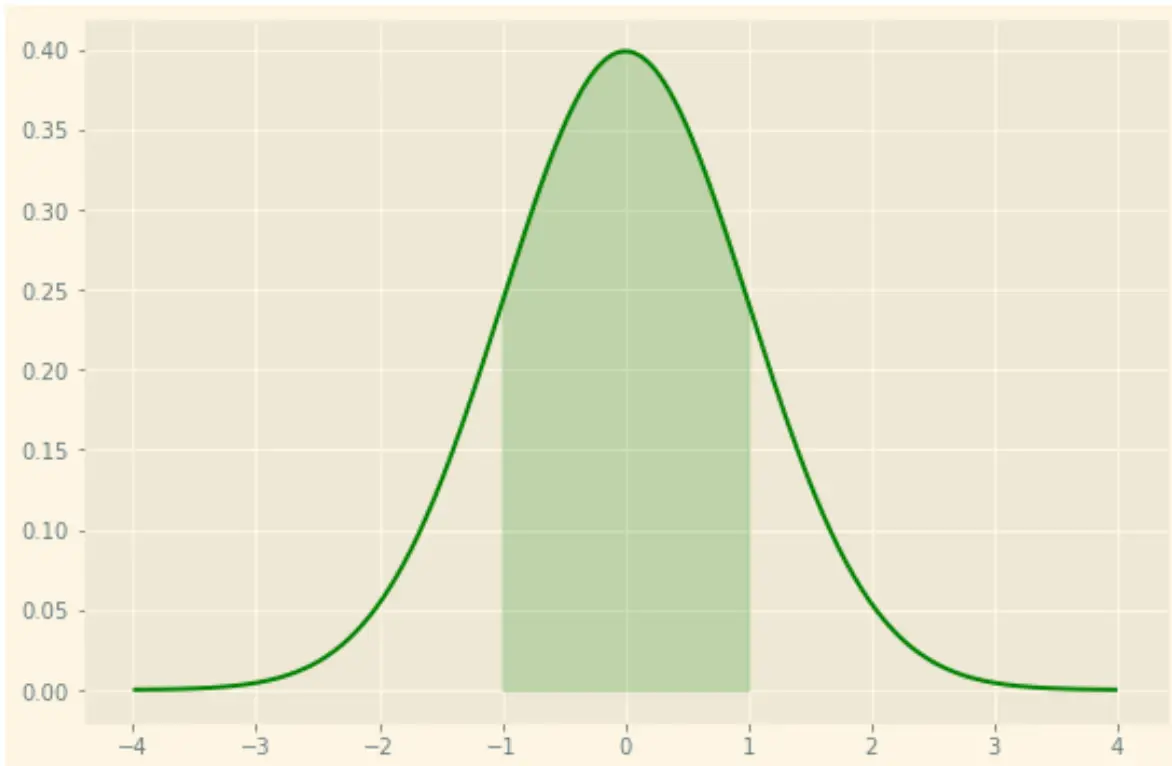
โปรดทราบว่าคุณสามารถจัดสไตล์พล็อตได้ตามที่คุณต้องการโดยใช้ตัวเลือกสไตล์มากมาย ของ matplotlib ตัวอย่างเช่น คุณสามารถใช้ธีม “แสงแดด” โดยมีเส้นสีเขียวและแรเงาสีเขียว:
 x = np.arange(-4, 4, 0.001)
y = norm.pdf(x,0,1)

fig, ax = plt.subplots(figsize=(9,6))
ax.plot(x,y, color=' green ')

#specify the region of the bell curve to fill in
x_fill = np.arange(-1, 1, 0.001)
y_fill = norm.pdf(x_fill,0,1)
ax.fill_between(x_fill,y_fill,0, alpha=0.2, color=' green ')

plt.style.use(' Solarize_Light2 ')
plt.show()
คุณสามารถดูคู่มืออ้างอิงสไตล์ชีทฉบับสมบูรณ์สำหรับ matplotlib ได้ที่นี่
แหล่งข้อมูลเพิ่มเติม
เกี่ยวกับผู้แต่ง
ดร.เบนจามิน แอนเดอร์สัน
สวัสดี ฉันชื่อเบนจามิน ศาสตราจารย์สถิติเกษียณอายุแล้ว และผันตัวมาเป็นครูสอนสถิติโดยเฉพาะ ด้วยประสบการณ์และความเชี่ยวชาญที่กว้างขวางในสาขาสถิติ ฉันกระตือรือร้นที่จะแบ่งปันความรู้ของฉันเพื่อเสริมศักยภาพนักเรียนผ่าน Statorials. รู้เพิ่มเติม