วิธีเปลี่ยนจำนวนเห็บใน matplotlib
คุณสามารถใช้ไวยากรณ์ต่อไปนี้เพื่อเปลี่ยนจำนวนเครื่องหมายบนแต่ละแกนใน Matplotlib:
 #specify number of ticks on x-axis
plt. locator_params (axis=' x ', nbins= 4 )

#specify number of ticks on y-axis
plt. locator_params (axis=' y ', nbins= 2 )
อาร์กิวเมนต์ nbins ระบุจำนวนขีดที่จะแสดงในแต่ละแกน
ตัวอย่างต่อไปนี้แสดงวิธีใช้ไวยากรณ์นี้ในทางปฏิบัติ
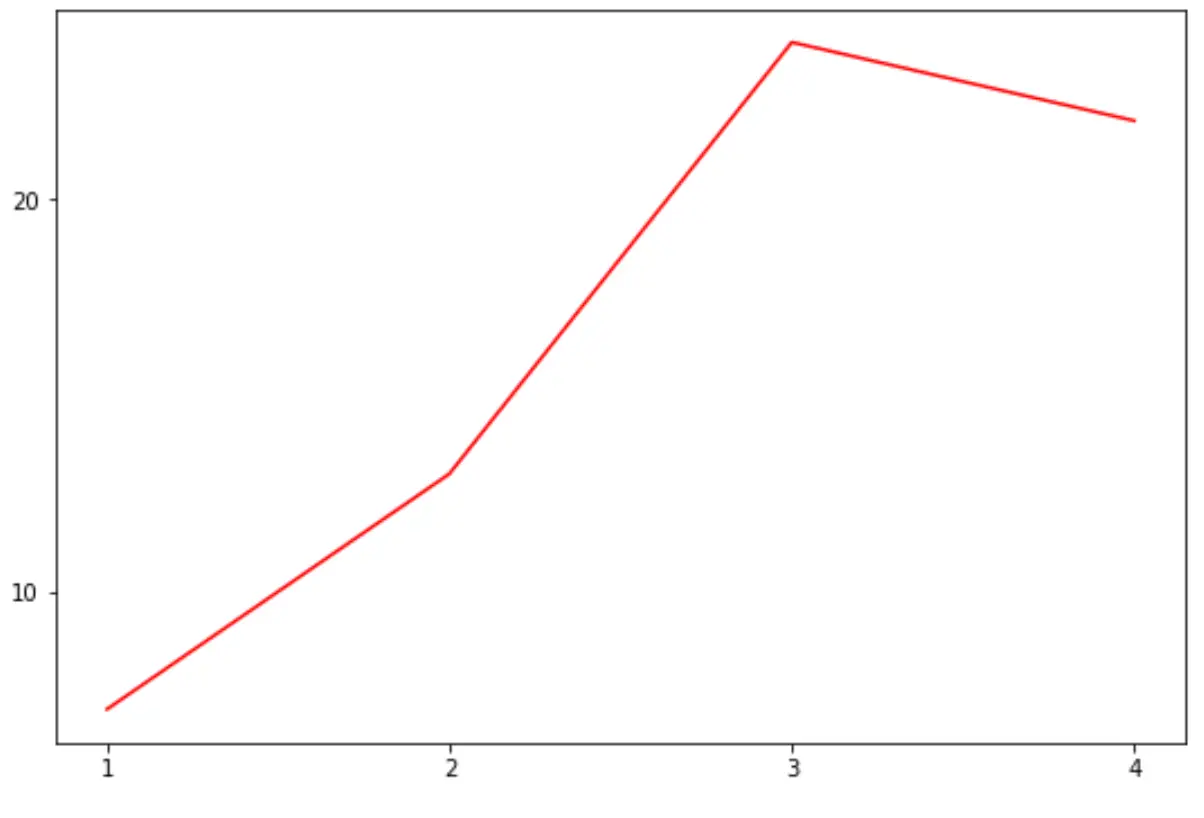
ตัวอย่างที่ 1: ระบุจำนวนขีดบนทั้งสองแกน
รหัสต่อไปนี้แสดงวิธีการระบุทั้งจำนวนเห็บบนแกนในพล็อต:
 import matplotlib. pyplot as plt

#define data
x = [1, 2, 3, 4]
y = [7, 13, 24, 22]

#createplot
plt. plot (x,y,color=' red ')

#specify number of ticks on axes
plt. locator_params (axis=' x ', nbins= 4 )
plt. locator_params (axis=' y ', nbins= 2 )

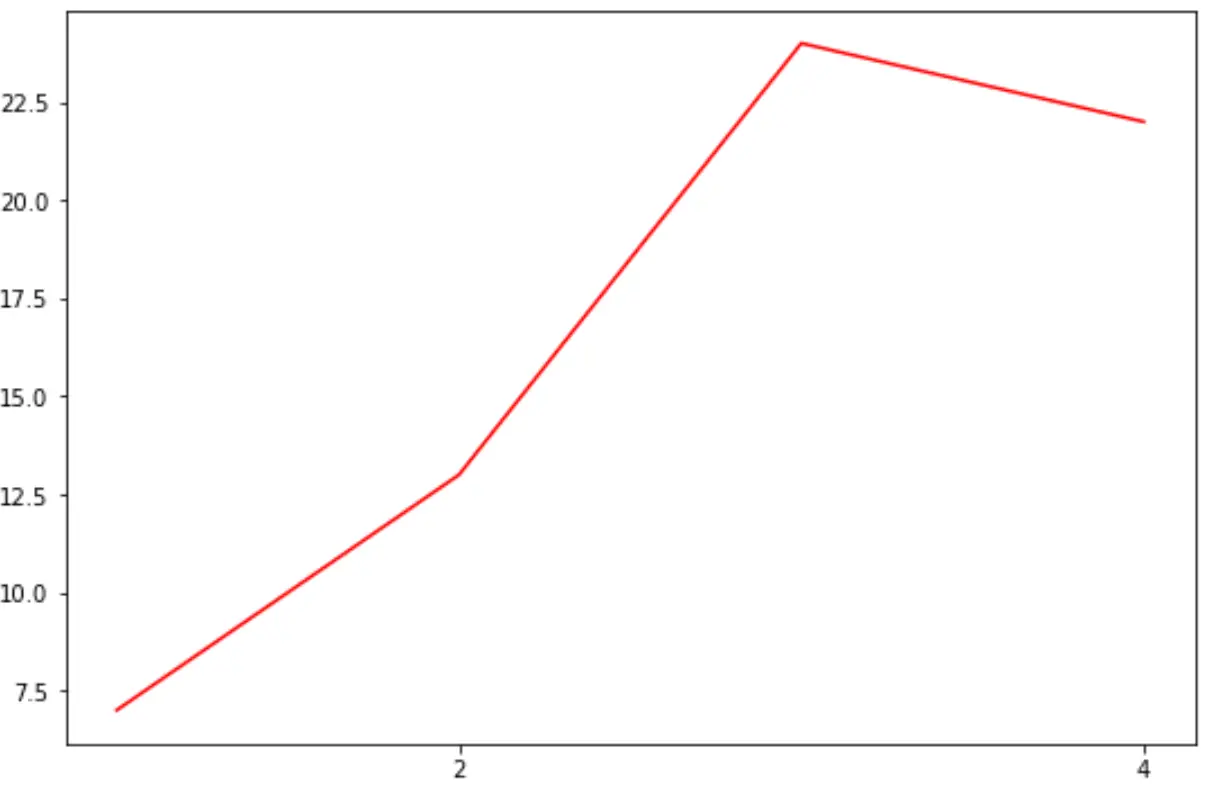
ตัวอย่างที่ 2: ระบุจำนวนเครื่องหมายถูกบนแกน X เท่านั้น
รหัสต่อไปนี้แสดงวิธีการระบุจำนวนขีดเฉพาะบนแกน X:
 import matplotlib. pyplot as plt

#define data
x = [1, 2, 3, 4]
y = [7, 13, 24, 22]

#createplot
plt. plot (x,y,color=' red ')

#specify number of ticks on x-axis
plt. locator_params (axis=' x ', nbins= 2 )

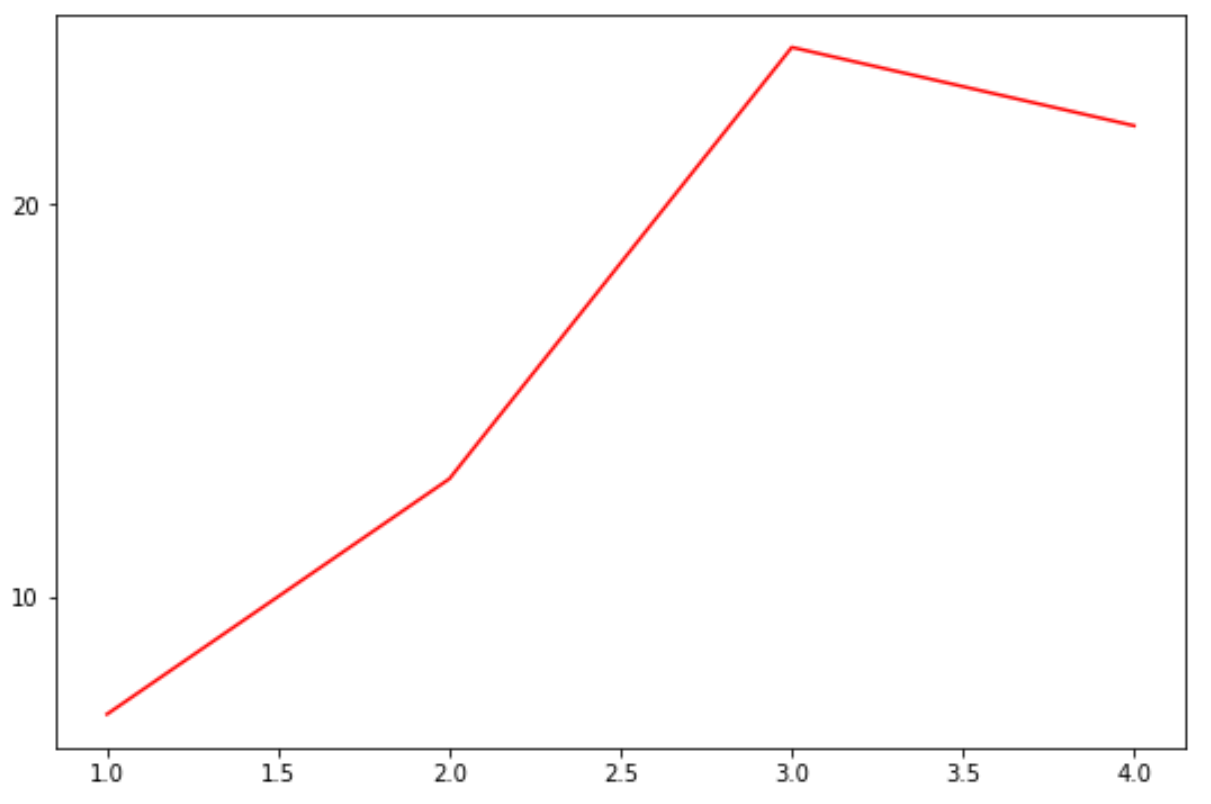
ตัวอย่างที่ 3: ระบุจำนวนเครื่องหมายถูกบนแกน Y เท่านั้น
รหัสต่อไปนี้แสดงวิธีการระบุจำนวนขีดเฉพาะบนแกน Y:
 import matplotlib. pyplot as plt

#define data
x = [1, 2, 3, 4]
y = [7, 13, 24, 22]

#createplot
plt. plot (x,y,color=' red ')

#specify number of ticks on y-axis
plt. locator_params (axis=' y ', nbins= 2 )

แหล่งข้อมูลเพิ่มเติม
วิธีลบเห็บออกจากแปลง Matplotlib
วิธีกำหนดขนาดตัวอักษรของป้ายกำกับเครื่องหมายถูกใน Matplotlib
วิธีการตั้งค่าแกน X ใน Matplotlib
วิธีการตั้งค่าช่วงแกนใน Matplotlib