วิธีการเปลี่ยนป้ายกำกับแกนบนแผน seaborn (พร้อมตัวอย่าง)
มีสองวิธีในการแก้ไขป้ายกำกับแกนบนแผนทางทะเล
วิธีแรกคือการใช้ฟังก์ชัน ax.set() ซึ่งใช้ไวยากรณ์ต่อไปนี้:
ax. set (xlabel=' x-axis label ', ylabel=' y-axis label ')
วิธีที่สองคือการใช้ฟังก์ชัน matplotlib ซึ่งใช้ไวยากรณ์ต่อไปนี้:
 plt. xlabel (' x-axis label ')
plt. ylabel (' y-axis label ')
ตัวอย่างต่อไปนี้แสดงวิธีการใช้แต่ละวิธีในทางปฏิบัติ
วิธีที่ 1: เปลี่ยนป้ายกำกับแกนโดยใช้ ax.set()
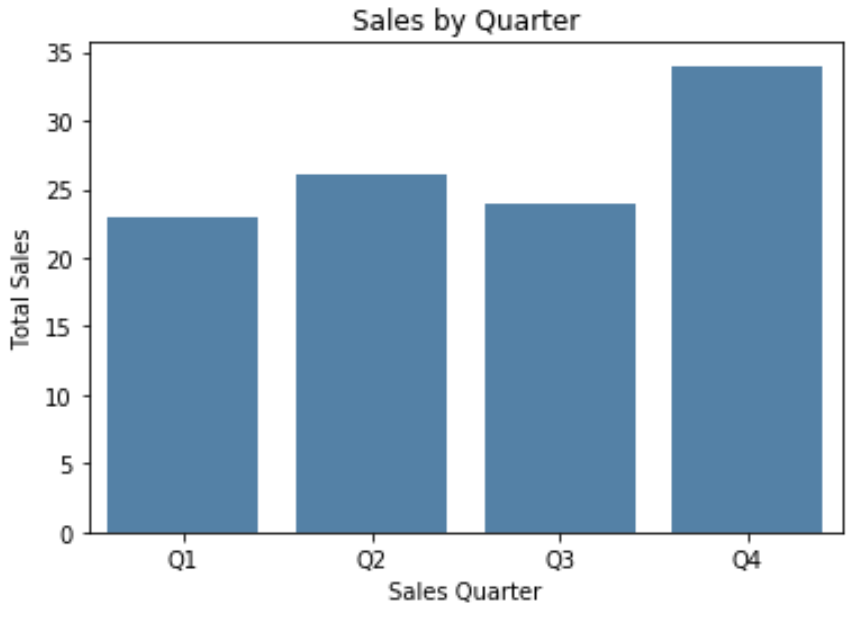
รหัสต่อไปนี้แสดงวิธีการสร้าง barplot ของ Seaborn และใช้ ax.set() เพื่อระบุป้ายกำกับแกน:
 import pandas as pd
import seaborn as sns
import matplotlib. pyplot as plt

#create some fake data
df = pd. DataFrame ({' quarter ': ['Q1', 'Q2', 'Q3', 'Q4'],
                   ' sales ': [23, 26, 24, 34]})

#create seaborn barplot
ax = sns. barplot (x=' quarter ', y=' sales ',
                 data = df,
                 color=' steelblue ')

#specfiy axis labels
ax. set (xlabel=' Sales Quarter ',
       ylabel=' Total Sales ',
       title=' Sales by Quarter ')

#display barplot
plt. show ()

วิธีที่ 2: เปลี่ยนป้ายกำกับแกนโดยใช้ฟังก์ชัน Matplotlib
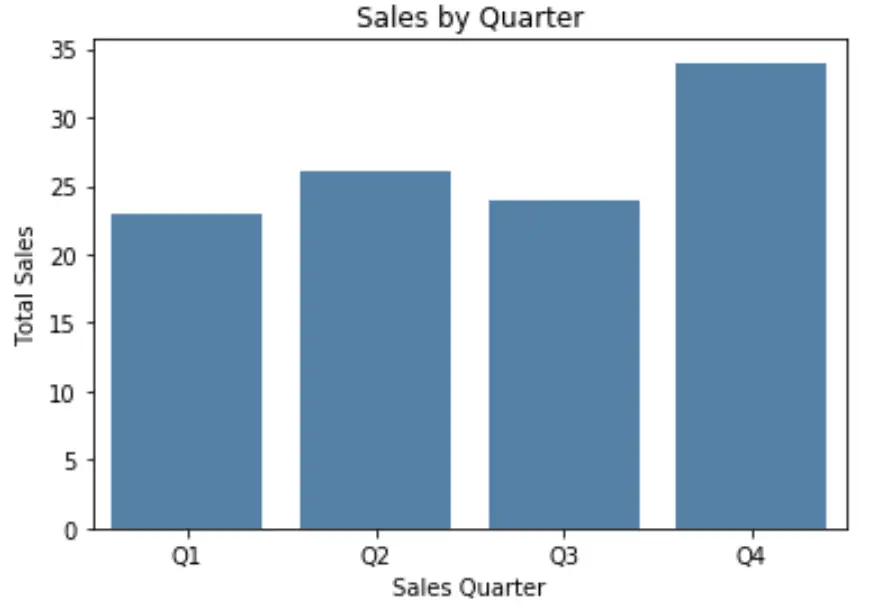
รหัสต่อไปนี้แสดงวิธีการสร้าง barplot ของ Seaborn และใช้ฟังก์ชัน matplotlib เพื่อระบุป้ายกำกับแกน:
 import pandas as pd
import seaborn as sns
import matplotlib. pyplot as plt

#create some fake data
df = pd. DataFrame ({' quarter ': ['Q1', 'Q2', 'Q3', 'Q4'],
                   ' sales ': [23, 26, 24, 34]})

#create seaborn barplot
ax = sns. barplot (x=' quarter ', y=' sales ',
                 data = df,
                 color=' steelblue ')

#specify axis labels
plt. xlabel (' Sales Quarter ')
plt. ylabel (' Total Sales ')
plt. title (' Sales by Quarter ')

#display barplot
plt. show ()

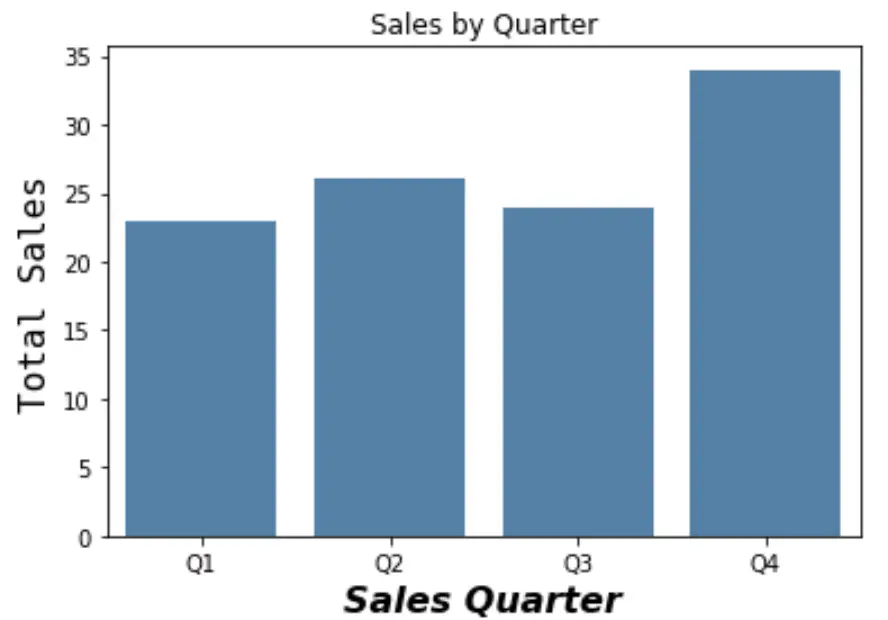
โปรดทราบว่าคุณยังสามารถระบุขนาดฟอนต์ ลักษณะฟอนต์ ตระกูลฟอนต์ และฟีเจอร์ฟอนต์อื่นๆ ได้โดยใช้วิธีนี้:
 #specify axis labels
plt. xlabel (' Sales Quarter ', size= 16 , fontstyle=' italic ', weight= 900 )
plt. ylabel (' Total Sales ', size= 16 , family=' minivan ')
plt. title (' Sales by Quarter ')

#display barplot
plt. show ()

โปรดดู เอกสารประกอบของ Matplotlib สำหรับรายการวิธีทั้งหมดที่คุณปรับแต่งแบบอักษรบนป้ายกำกับแกนได้