วิธีการพล็อตซีรี่ส์ pandas (พร้อมตัวอย่าง)
มีสองวิธีทั่วไปในการพล็อตค่าในชุดหมีแพนด้า:
วิธีที่ 1: สร้างพล็อตเส้นจากซีรีส์ Pandas
 import pandas as pd
import matplotlib. pyplot as plt

plt. plot ( my_series.index , my_series.values )
วิธีที่ 2: สร้างฮิสโตแกรมจาก Pandas Series
 import pandas as pd
import matplotlib. pyplot as plt

my_series. plot (kind=' hist ')
ตัวอย่างต่อไปนี้แสดงวิธีการใช้แต่ละวิธีในทางปฏิบัติ
ตัวอย่างที่ 1: สร้างโครงเรื่องจากชุดหมีแพนด้า
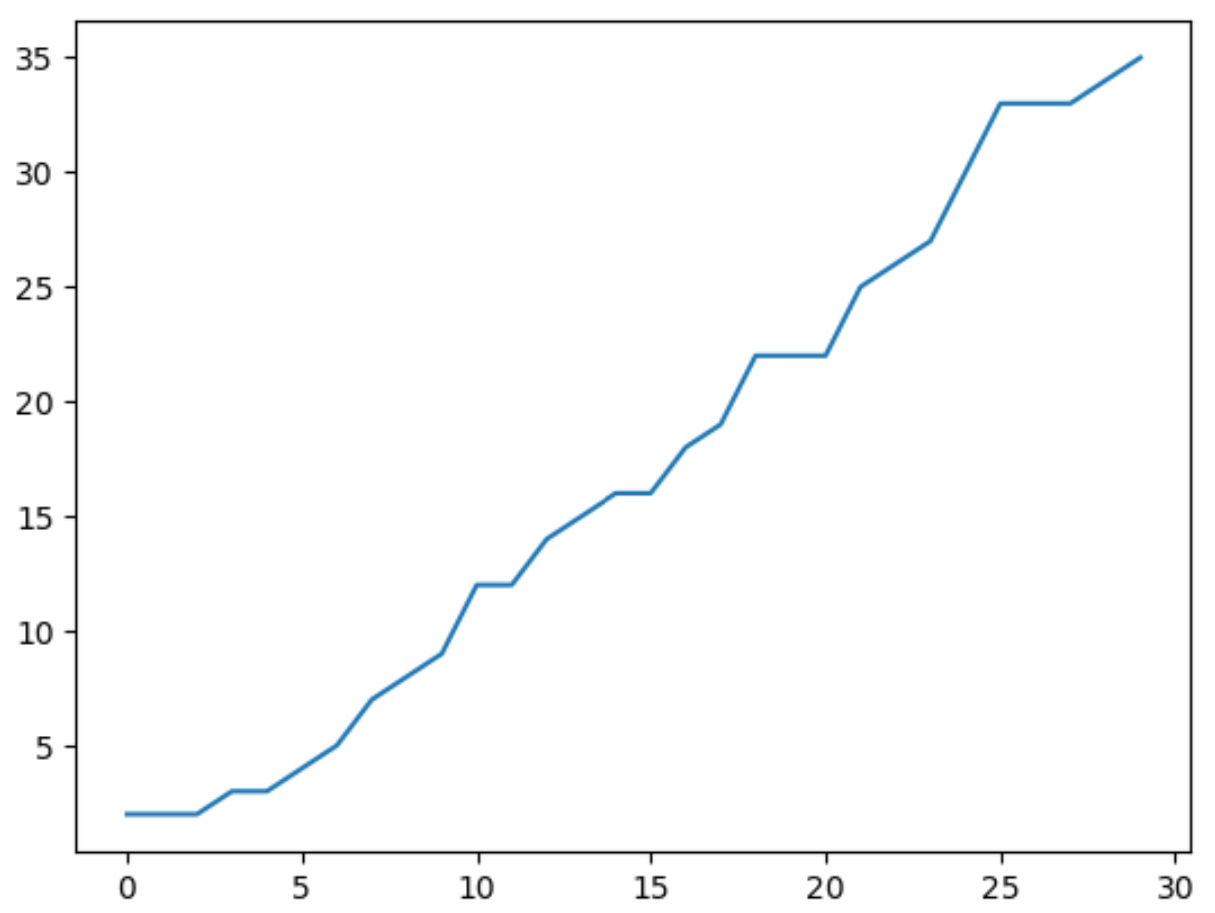
รหัสต่อไปนี้แสดงวิธีการสร้างเส้นลงจุดจากชุดหมีแพนด้า:
 import pandas as pd
import matplotlib. pyplot as plt

#create pandas Series
my_series = pd. Series ([2, 2, 2, 3, 3, 4, 5, 7, 8, 9, 12, 12, 14, 15, 16, 16, 18,
                       19, 22, 22, 22, 25, 26, 27, 30, 33, 33, 33, 34, 35])

#create line plot to visualize values in Series
plt. plot ( my_series.index , my_series.values )

แกน x แสดงค่าดัชนีของอนุกรมแพนด้า และแกน y แสดงค่าที่แท้จริงของอนุกรม
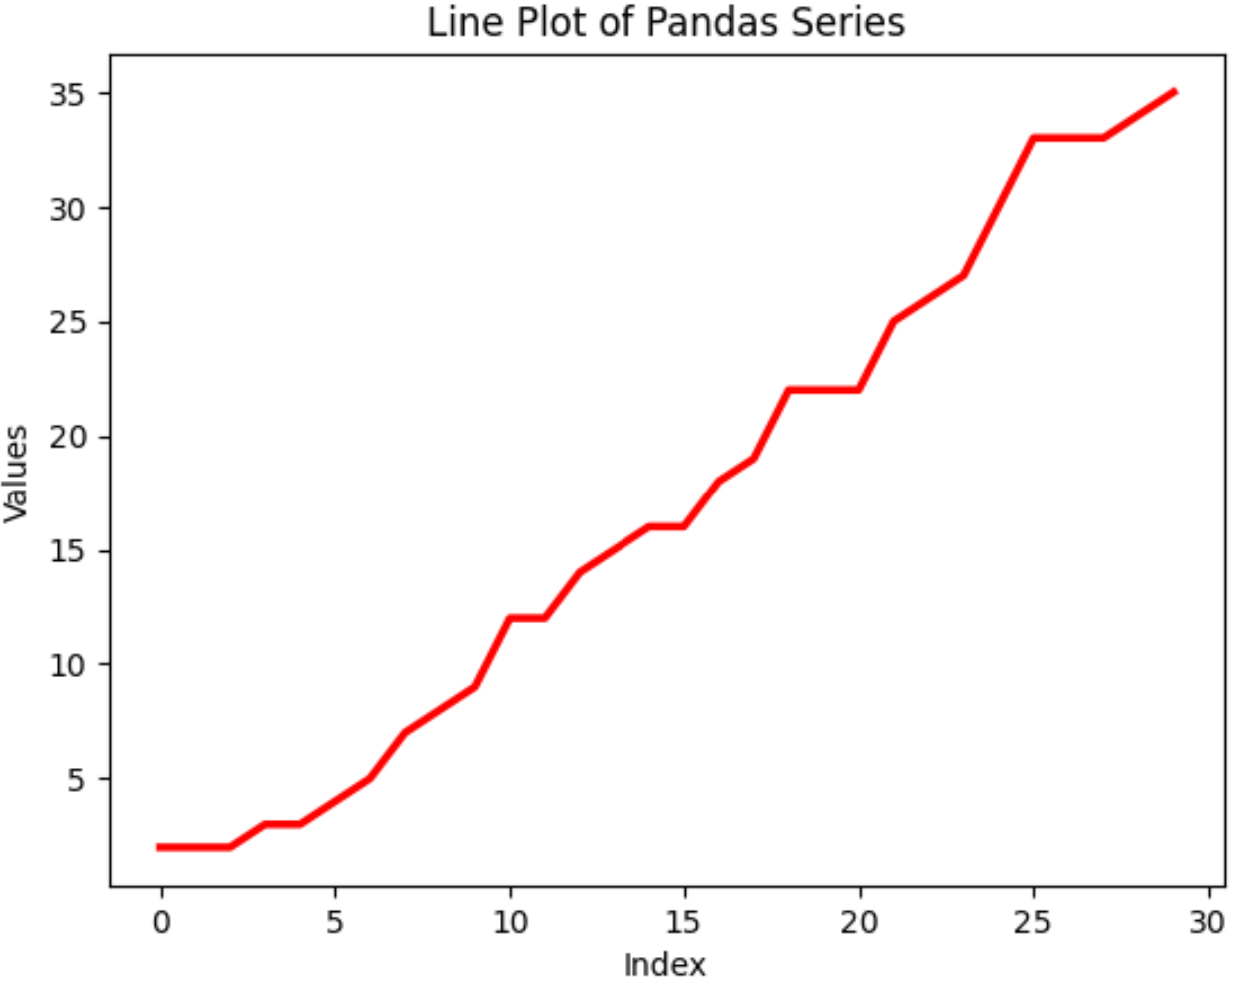
คุณยังสามารถใช้ฟังก์ชัน pandas และ matplotlib ต่างๆ เพื่อปรับแต่งลักษณะที่ปรากฏของเส้นตลอดจนป้ายกำกับแกนและชื่อพล็อต:
 #create customized line plot
plt. plot (my_series. index , my_series. values , color=' red ', linewidth= 2.5 )

#add axis labels and title
plt. xlabel (' Index ')
plt. ylabel (' Values ')
plt. title (' Line Plot of Pandas Series ')

ตัวอย่างที่ 2: สร้างฮิสโตแกรมจากชุดหมีแพนด้า
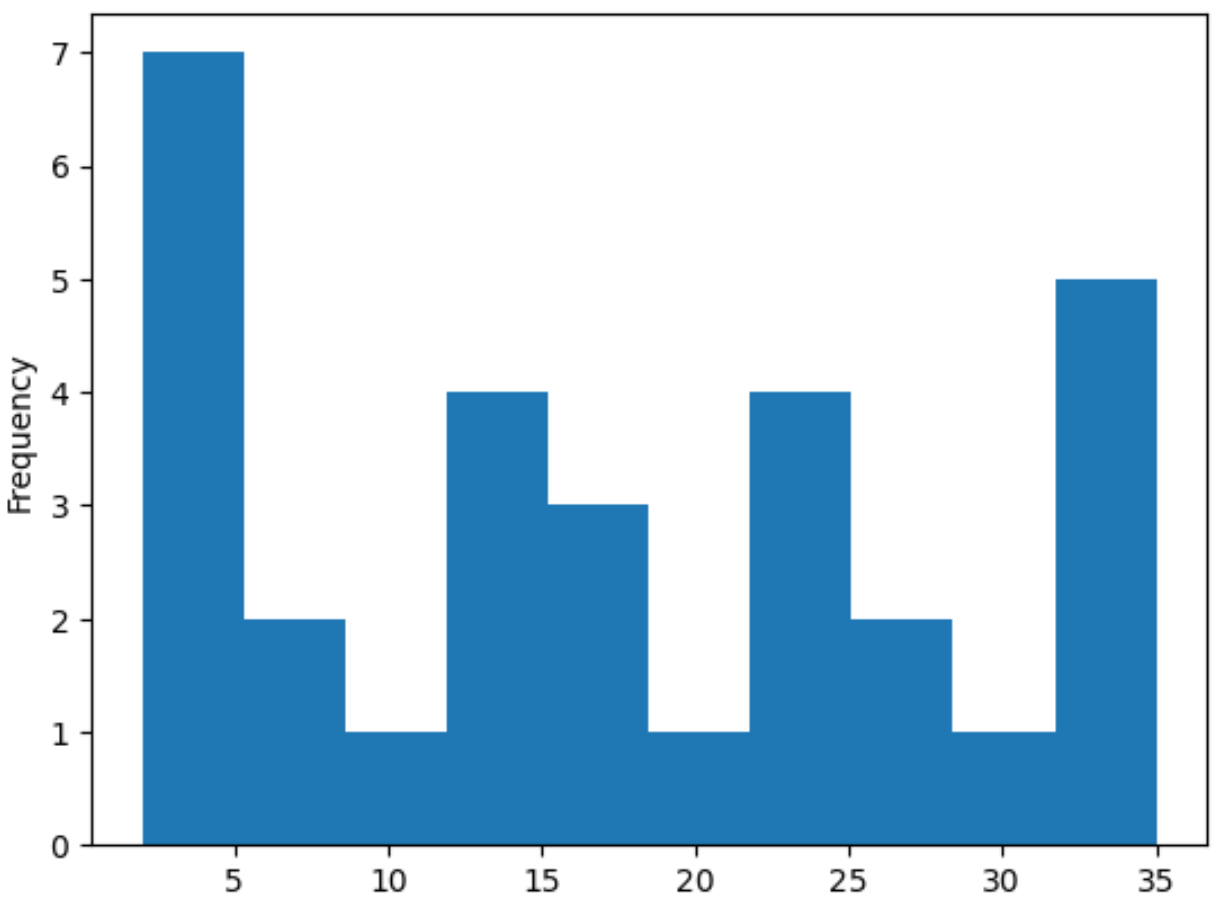
รหัสต่อไปนี้แสดงวิธีการสร้างฮิสโตแกรมจากชุดหมีแพนด้า:
 import pandas as pd
import matplotlib. pyplot as plt

#create pandas Series
my_series = pd. Series ([2, 2, 2, 3, 3, 4, 5, 7, 8, 9, 12, 12, 14, 15, 16, 16, 18,
                       19, 22, 22, 22, 25, 26, 27, 30, 33, 33, 33, 34, 35])

#create histogram visualize distribution of values in Series
my_series. plot (kind=' hist ')

แกน x แสดงค่าของชุดหมีแพนด้า และแกน y แสดงความถี่ของค่า
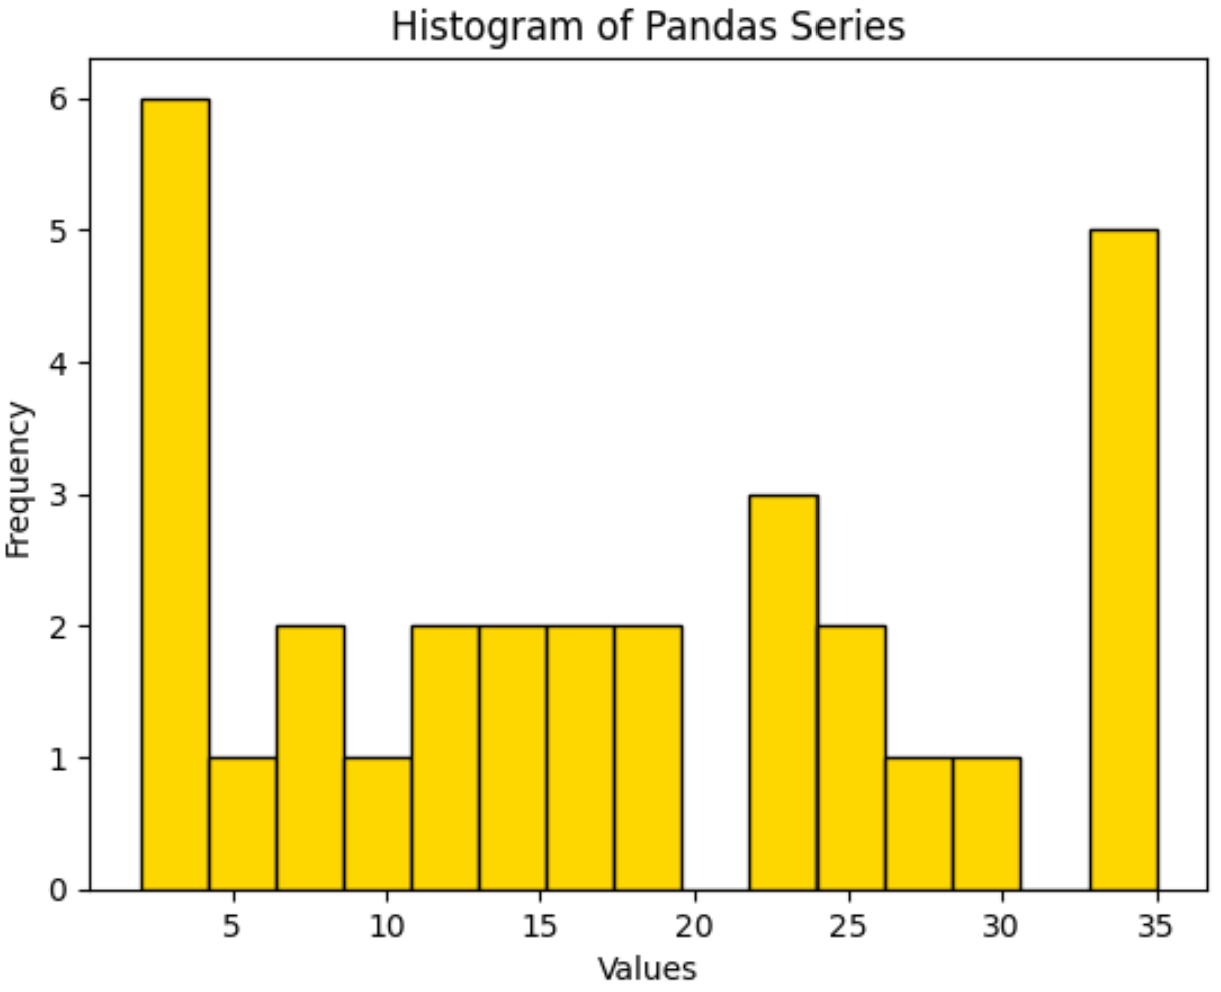
คุณยังสามารถใช้ฟังก์ชัน pandas และ matplotlib ต่างๆ เพื่อปรับแต่งลักษณะที่ปรากฏของฮิสโตแกรมตลอดจนจำนวนถังขยะที่ใช้ในฮิสโตแกรม:
 #create histogram with 15 bins
my_series. plot (kind=' hist ', edgecolor=' black ', color=' gold ', bins= 15 )

#add axis labels and title
plt. xlabel (' Values ')
plt. title (' Histogram of Pandas Series ')

โปรดทราบว่าจำนวนกลุ่มเริ่มต้นที่ใช้ในฮิสโตแกรมคือ 10
คุณสามารถใช้อาร์กิวเมนต์ bins เพื่อเพิ่มจำนวนนี้เพื่อสร้างถังขยะมากขึ้น หรือลดจำนวนนี้เพื่อสร้างถังขยะน้อยลง
แหล่งข้อมูลเพิ่มเติม
บทช่วยสอนต่อไปนี้จะอธิบายวิธีการทำงานทั่วไปอื่นๆ ในแพนด้า:
วิธีกรองชุด Pandas ตามค่า
วิธีแปลง Pandas Series เป็น DataFrame
วิธีแปลงซีรีย์ Pandas เป็นอาร์เรย์ NumPy