วิธีการตั้งค่าแกน x ใน matplotlib
คุณสามารถใช้ไวยากรณ์ต่อไปนี้เพื่อตั้งค่าแกน X สำหรับพล็อตใน Matplotlib:
 #specify x-axis locations
x_ticks = [2, 4, 6, 8, 10]

#specify x-axis labels
x_labels = ['A', 'B', 'C', 'D', 'E']

#add x-axis values to plot
plt. xticks (ticks=x_ticks, labels=x_labels)
ตัวอย่างต่อไปนี้แสดงวิธีใช้ไวยากรณ์นี้ในทางปฏิบัติ
ตัวอย่างที่ 1: ตั้งค่าแกน X ในช่วงเวลาเท่ากัน
รหัสต่อไปนี้แสดงวิธีการตั้งค่าแกน X ในช่วงเวลาเท่ากันใน Matplotlib:
 import matplotlib. pyplot as plt

#define x and y
x = [1, 4, 10]
y = [5, 11, 27]

#create plot of x and y
plt. plot (x, y)

#specify x-axis locations
x_ticks = [2, 4, 6, 8, 10]

#specify x-axis labels
x_labels = ['A', 'B', 'C', 'D', 'E']

#add x-axis values to plot
plt. xticks (ticks=x_ticks, labels=x_labels)
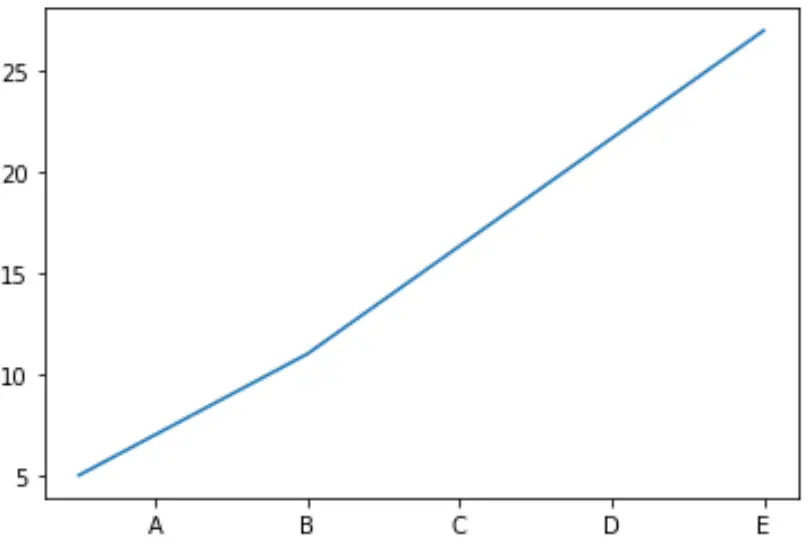
โปรดทราบว่าค่าแกน X แต่ละค่าจะปรากฏในช่วงเวลาที่เท่ากัน
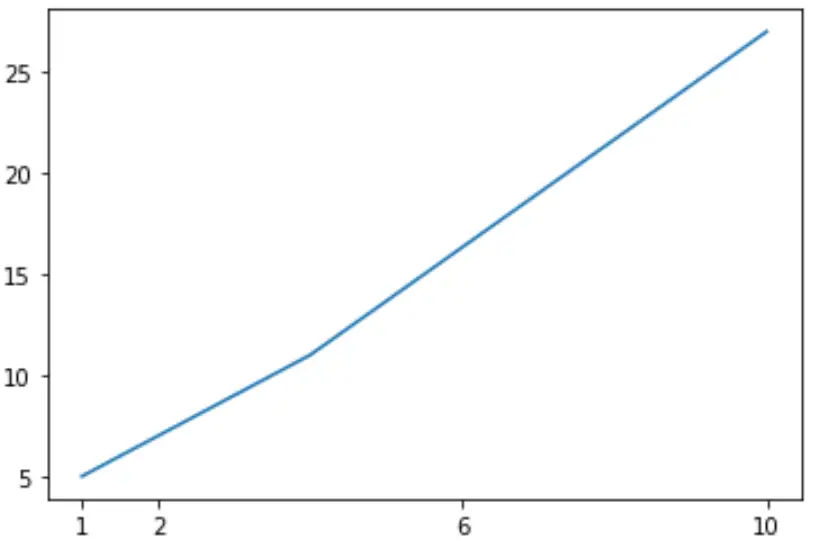
ตัวอย่างที่ 2: ตั้งค่าแกน X ในช่วงไม่เท่ากัน
รหัสต่อไปนี้แสดงวิธีการตั้งค่าแกน X ในช่วงเวลาที่ไม่เท่ากันใน Matplotlib:
 import matplotlib. pyplot as plt

#define x and y
x = [1, 4, 10]
y = [5, 11, 27]

#create plot of x and y
plt. plot (x, y)

#specify x-axis locations
x_ticks = [1, 2, 6, 10]

#specify x-axis labels
x_labels = [1, 2, 6, 10]

#add x-axis values to plot
plt. xticks (ticks=x_ticks, labels=x_labels)
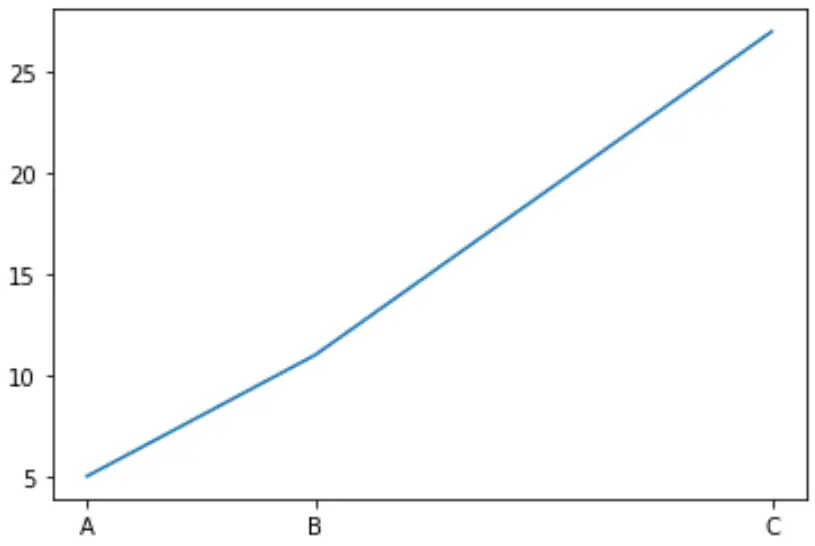
ตัวอย่างที่ 3: ตั้งค่าแกน X เป็นจุดข้อมูลเท่านั้น
รหัสต่อไปนี้แสดงวิธีการตั้งค่าแกน X ที่จุดข้อมูลเท่านั้น:
 import matplotlib. pyplot as plt

#define x and y
x = [1, 4, 10]
y = [5, 11, 27]

#create plot of x and y
plt. plot (x, y)

#specify x-axis labels
x_labels = ['A', 'B', 'C']

#add x-axis values to plot
plt. xticks (ticks=x, labels=x_labels)
หมายเหตุ: คุณสามารถดูเอกสารฉบับเต็มสำหรับฟังก์ชัน plt.xticks() ได้ที่นี่
แหล่งข้อมูลเพิ่มเติม
วิธีการตั้งค่าช่วงแกนใน Matplotlib
วิธีกำหนดขนาดตัวอักษรของป้ายกำกับเครื่องหมายถูกใน Matplotlib
วิธีสร้างแปลง Matplotlib หลายแปลงในรูปเดียว
เกี่ยวกับผู้แต่ง
ดร.เบนจามิน แอนเดอร์สัน
สวัสดี ฉันชื่อเบนจามิน ศาสตราจารย์สถิติเกษียณอายุแล้ว และผันตัวมาเป็นครูสอนสถิติโดยเฉพาะ ด้วยประสบการณ์และความเชี่ยวชาญที่กว้างขวางในสาขาสถิติ ฉันกระตือรือร้นที่จะแบ่งปันความรู้ของฉันเพื่อเสริมศักยภาพนักเรียนผ่าน Statorials. รู้เพิ่มเติม