วิธีเพิ่มป้ายกำกับให้กับ geom_hline ใน ggplot2
คุณสามารถใช้ไวยากรณ์พื้นฐานต่อไปนี้เพื่อเพิ่มป้ายกำกับให้กับเส้นแนวนอนใน ggplot2:
+ annotate(" text ", x= 9 , y= 20 , label=" Here is my text ")
ตัวอย่างต่อไปนี้แสดงวิธีใช้ไวยากรณ์นี้ในทางปฏิบัติ
ตัวอย่างที่ 1: เพิ่มป้ายกำกับให้กับ geom_hline
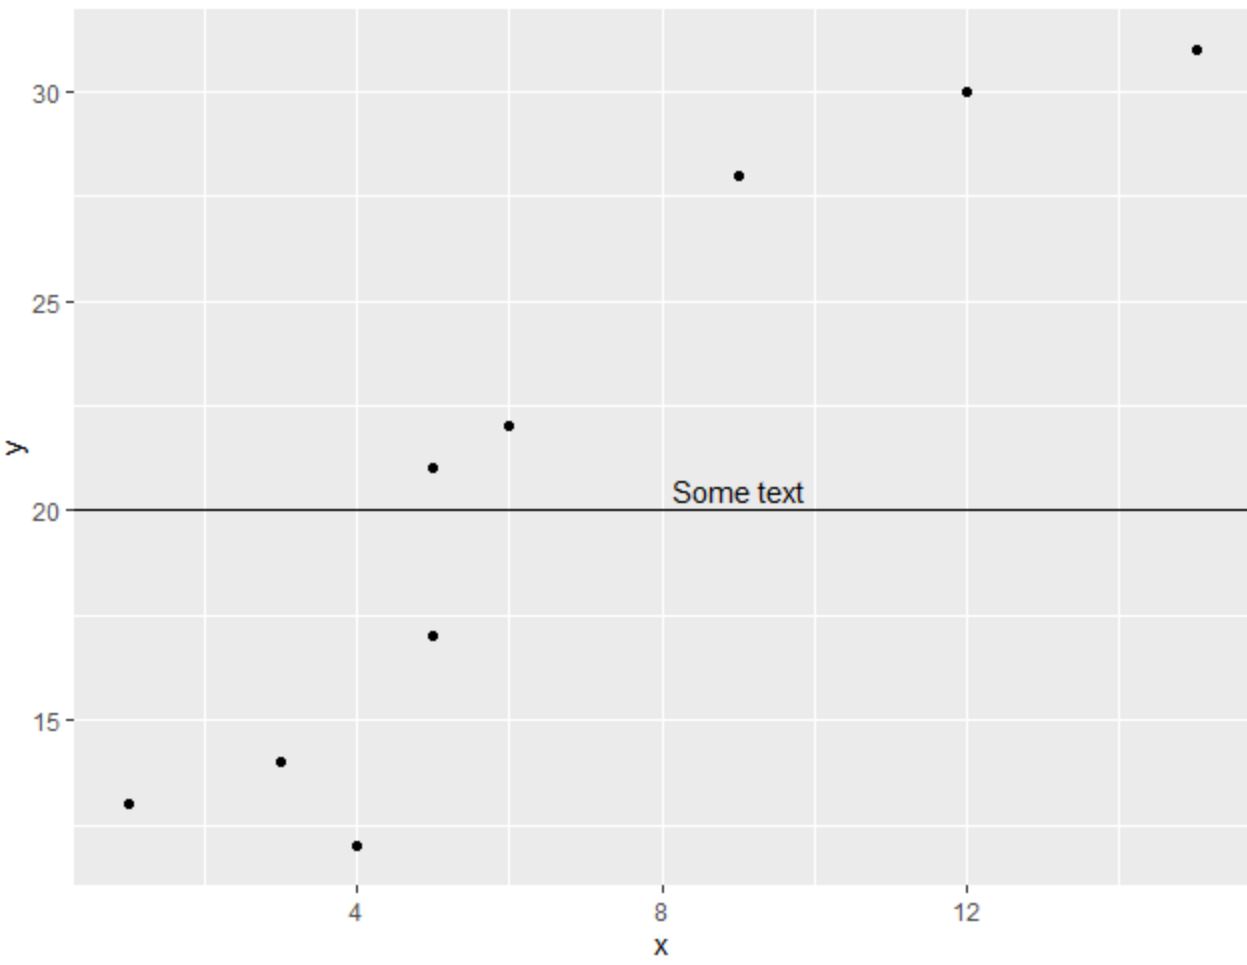
รหัสต่อไปนี้แสดงวิธีเพิ่มป้ายกำกับให้กับเส้นแนวนอนใน ggplot2:
 library (ggplot2)

#create data frame
df <- data. frame (x=c(1, 3, 3, 4, 5, 5, 6, 9, 12, 15),
                 y=c(13, 14, 14, 12, 17, 21, 22, 28, 30, 31))

#create scatterplot with horizontal line at y=20
ggplot(df, aes(x=x, y=y)) +
geom_point() +
  geom_hline(yintercept= 20 ) +
  annotate("text", x= 9 , y= 20.5 , label=" Some text ")
ตัวอย่างที่ 2: เพิ่มป้ายกำกับที่กำหนดเองให้กับ geom_hline
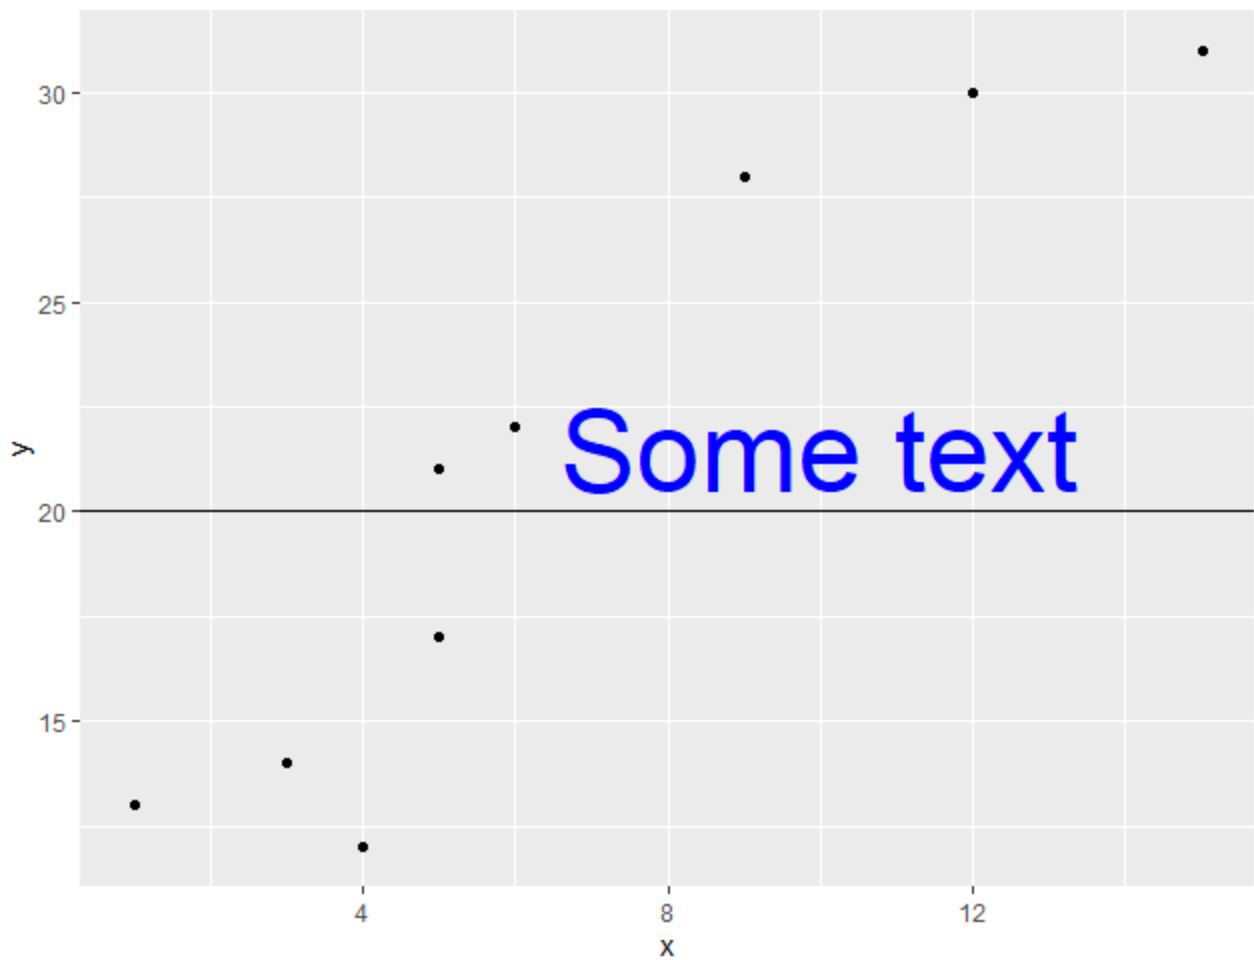
รหัสต่อไปนี้แสดงวิธีใช้อาร์กิวเมนต์ ขนาด และ สี เพื่อเพิ่มป้ายกำกับที่มีขนาดและสีที่กำหนดเองให้กับเส้นแนวนอนใน ggplot2:
 library (ggplot2)

#create data frame
df <- data. frame (x=c(1, 3, 3, 4, 5, 5, 6, 9, 12, 15),
                 y=c(13, 14, 14, 12, 17, 21, 22, 28, 30, 31))

#create scatterplot with horizontal line at y=20
ggplot(df, aes(x=x, y=y)) +
geom_point() +
  geom_hline(yintercept= 20 ) +
  annotate("text", x= 10 , y= 21.5 , label=" Some text ", size= 15 , color=" blue ")
ตัวอย่างที่ 3: เพิ่มป้ายกำกับหลายรายการใน geom_hline
รหัสต่อไปนี้แสดงวิธีใช้ฟังก์ชัน คำอธิบายประกอบ () หลายครั้งเพื่อเพิ่มป้ายกำกับหลายรายการให้กับเส้นแนวนอนใน ggplot2:
 library (ggplot2)

#create data frame
df <- data. frame (x=c(1, 3, 3, 4, 5, 5, 6, 9, 12, 15),
                 y=c(13, 14, 14, 12, 17, 21, 22, 28, 30, 31))

#create scatterplot with horizontal line at y=10
ggplot(df, aes(x=x, y=y)) +
geom_point() +
  geom_hline(yintercept= 20 ) +
  annotate("text", x= 10 , y= 19 , label=" Some text ", size= 15 , color=" blue ") +
  annotate("text", x= 10 , y= 21 , label=" More text ", size= 9 , color=" red ")
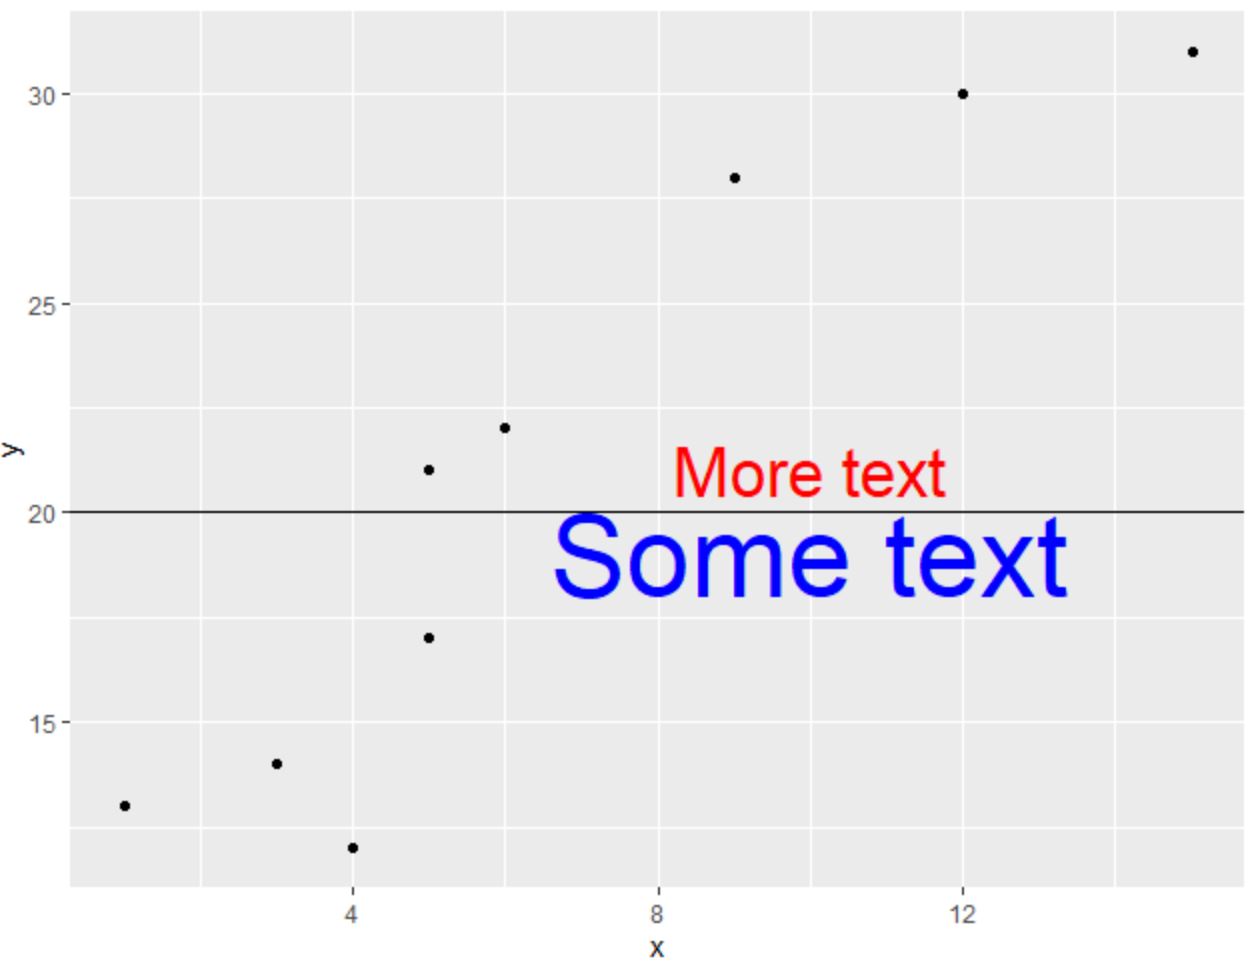
คุณสามารถใช้ฟังก์ชัน คำอธิบายประกอบ () ได้บ่อยเท่าที่คุณต้องการเพิ่มป้ายกำกับให้พล็อตได้มากเท่าที่คุณต้องการ
แหล่งข้อมูลเพิ่มเติม
บทช่วยสอนต่อไปนี้จะอธิบายวิธีดำเนินการงานทั่วไปอื่นๆ ใน ggplot2:
วิธีเพิ่มป้ายกำกับให้กับ geom_vline ใน ggplot2
วิธีเพิ่มเส้นเฉลี่ยเพื่อลงจุดใน ggplot2
วิธีเปลี่ยนสีเส้นใน ggplot2
เกี่ยวกับผู้แต่ง
ดร.เบนจามิน แอนเดอร์สัน
สวัสดี ฉันชื่อเบนจามิน ศาสตราจารย์สถิติเกษียณอายุแล้ว และผันตัวมาเป็นครูสอนสถิติโดยเฉพาะ ด้วยประสบการณ์และความเชี่ยวชาญที่กว้างขวางในสาขาสถิติ ฉันกระตือรือร้นที่จะแบ่งปันความรู้ของฉันเพื่อเสริมศักยภาพนักเรียนผ่าน Statorials. รู้เพิ่มเติม