วิธีเปลี่ยนระยะขอบใน ggplot2 (พร้อมตัวอย่าง)
คุณสามารถใช้อาร์กิวเมนต์ theme() ใน ggplot2 เพื่อแก้ไขพื้นที่ระยะขอบของพล็อตได้:
 ggplot(df, aes(x=x)) +
  geom_histogram() +
  theme(plot. margin =unit(c(5,1,1,1), ' cm '))
โปรดทราบว่าลำดับของระยะขอบของพล็อตเป็นดังนี้:
- หน่วย(c(บน, ขวา, ล่าง, ซ้าย), หน่วย)
ตัวอย่างต่อไปนี้แสดงวิธีการเปลี่ยนพื้นที่ระยะขอบของแปลง ggplot2 ในทางปฏิบัติ
ตัวอย่างที่ 1: สร้างโครงเรื่องพื้นฐาน
รหัสต่อไปนี้แสดงวิธีสร้างพล็อตพื้นฐานใน ggplot2 โดยไม่ต้องระบุพื้นที่ระยะขอบ:
 library (ggplot2)

#make this example reproducible
set. seeds (0)

#create data
df <- data. frame (x=rnorm(n= 5000 ))

#create histogram using ggplot2
ggplot(df, aes(x=x)) +
  geom_histogram() +
  ggtitle(' Title of Histogram ') +
  theme(plot. background =element_rect(fill=' #e3fbff '))

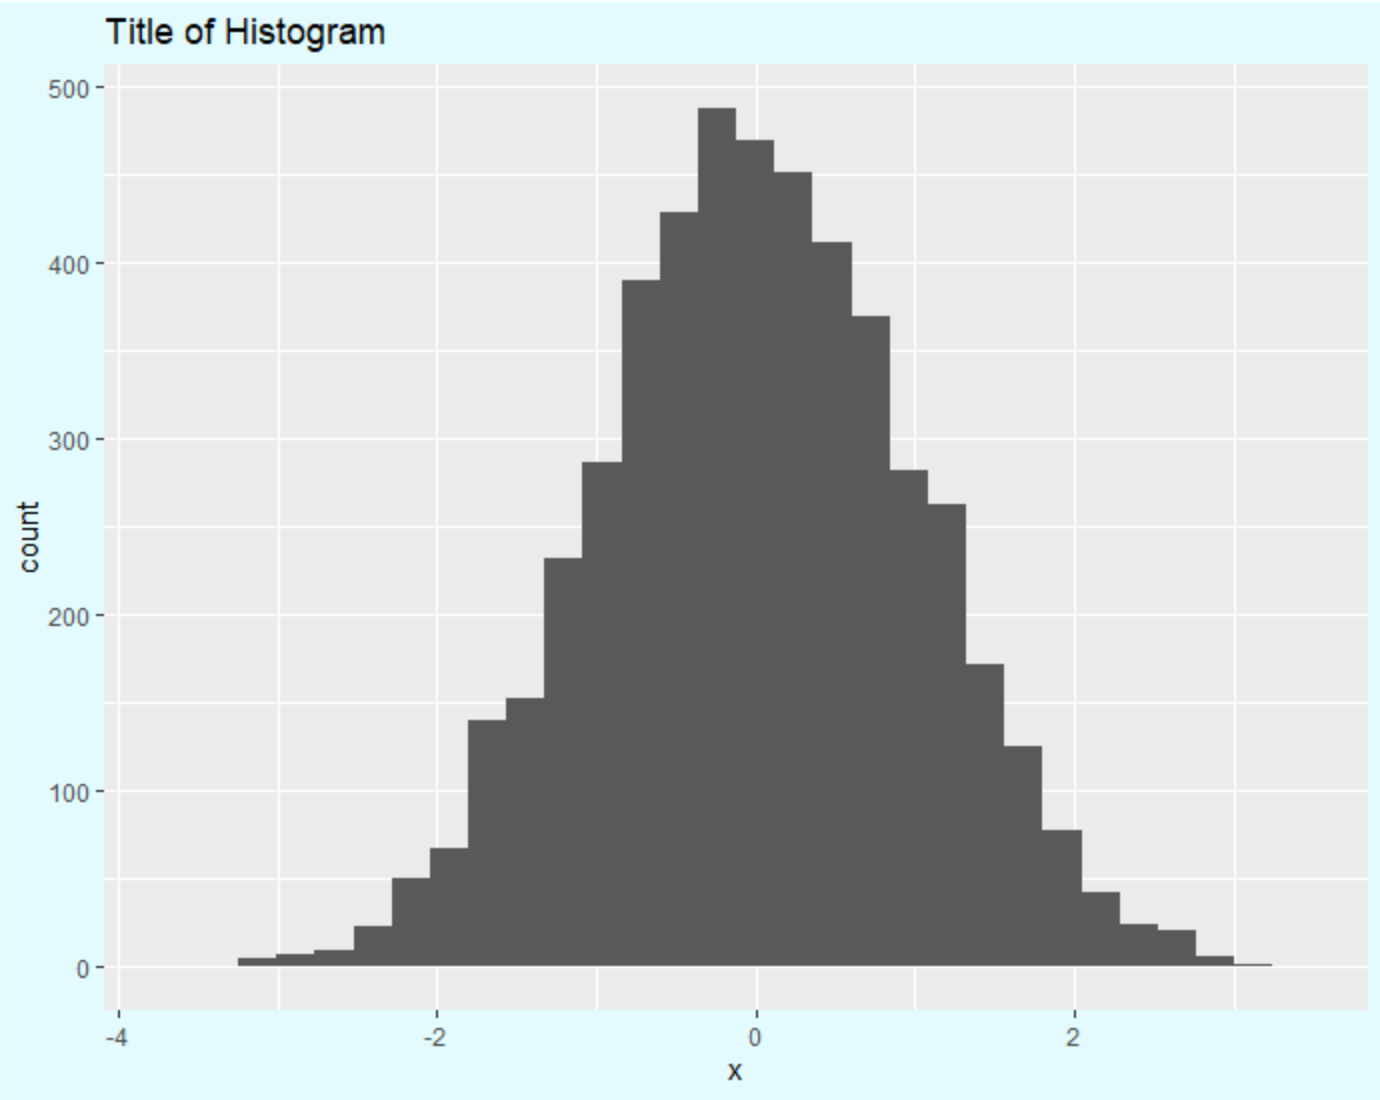
โปรดสังเกตว่าโครงเรื่องมีระยะขอบน้อยที่สุดในแต่ละด้าน
ตัวอย่างที่ 2: เปลี่ยนระยะขอบการลงจุด
รหัสต่อไปนี้แสดงวิธีการเพิ่มระยะขอบที่มีนัยสำคัญที่ด้านบนและด้านล่างของโครงเรื่อง:
 library (ggplot2)

#make this example reproducible
set. seeds (0)

#create data
df <- data. frame (x=rnorm(n= 5000 ))

#create histogram with significant margins on top and bottom
ggplot(df, aes(x=x)) +
  geom_histogram() +
  ggtitle(' Title of Histogram ') +
  theme(plot. margin =unit(c(5,1,5,1), ' cm '),
        plot. background =element_rect(fill=' #e3fbff '))

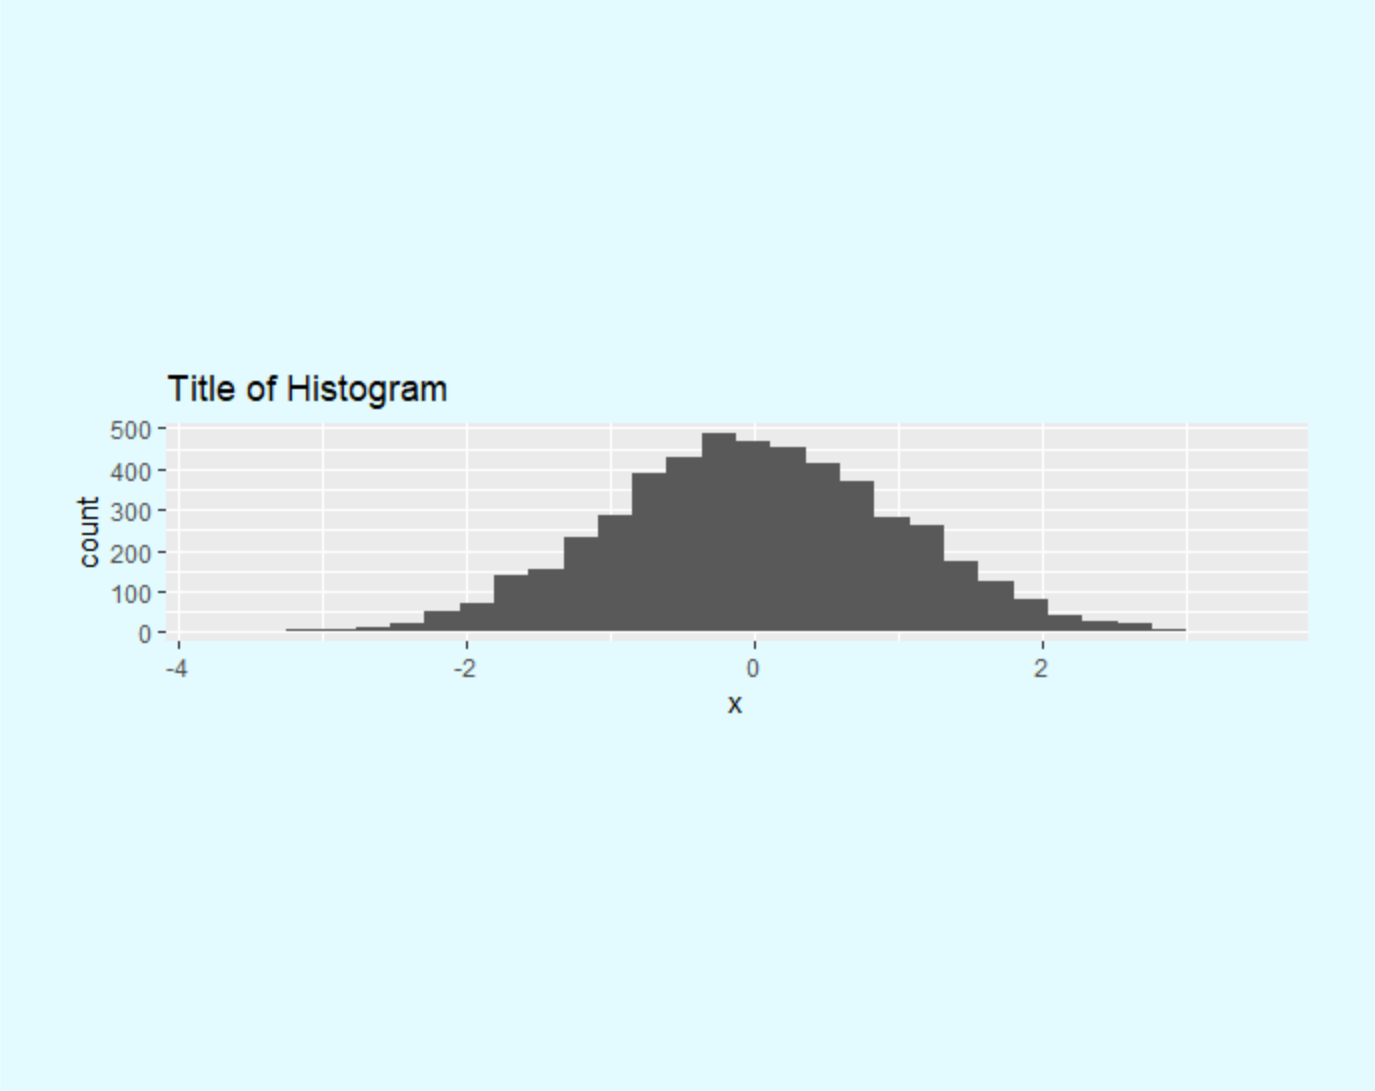
โปรดสังเกตว่ามีพื้นที่ด้านบนและด้านล่างของพล็อตเป็นจำนวนมาก
และโค้ดต่อไปนี้แสดงวิธีเพิ่มระยะขอบที่สำคัญทางซ้ายและขวาของโครงเรื่อง:
 library (ggplot2)

#make this example reproducible
set. seeds (0)

#create data
df <- data. frame (x=rnorm(n= 5000 ))

#create histogram with significant margins on left and right
ggplot(df, aes(x=x)) +
  geom_histogram() +
  ggtitle(' Title of Histogram ') +
  theme(plot. margin =unit(c(1,5,1,5), ' cm '),
        plot. background =element_rect(fill=' #e3fbff '))

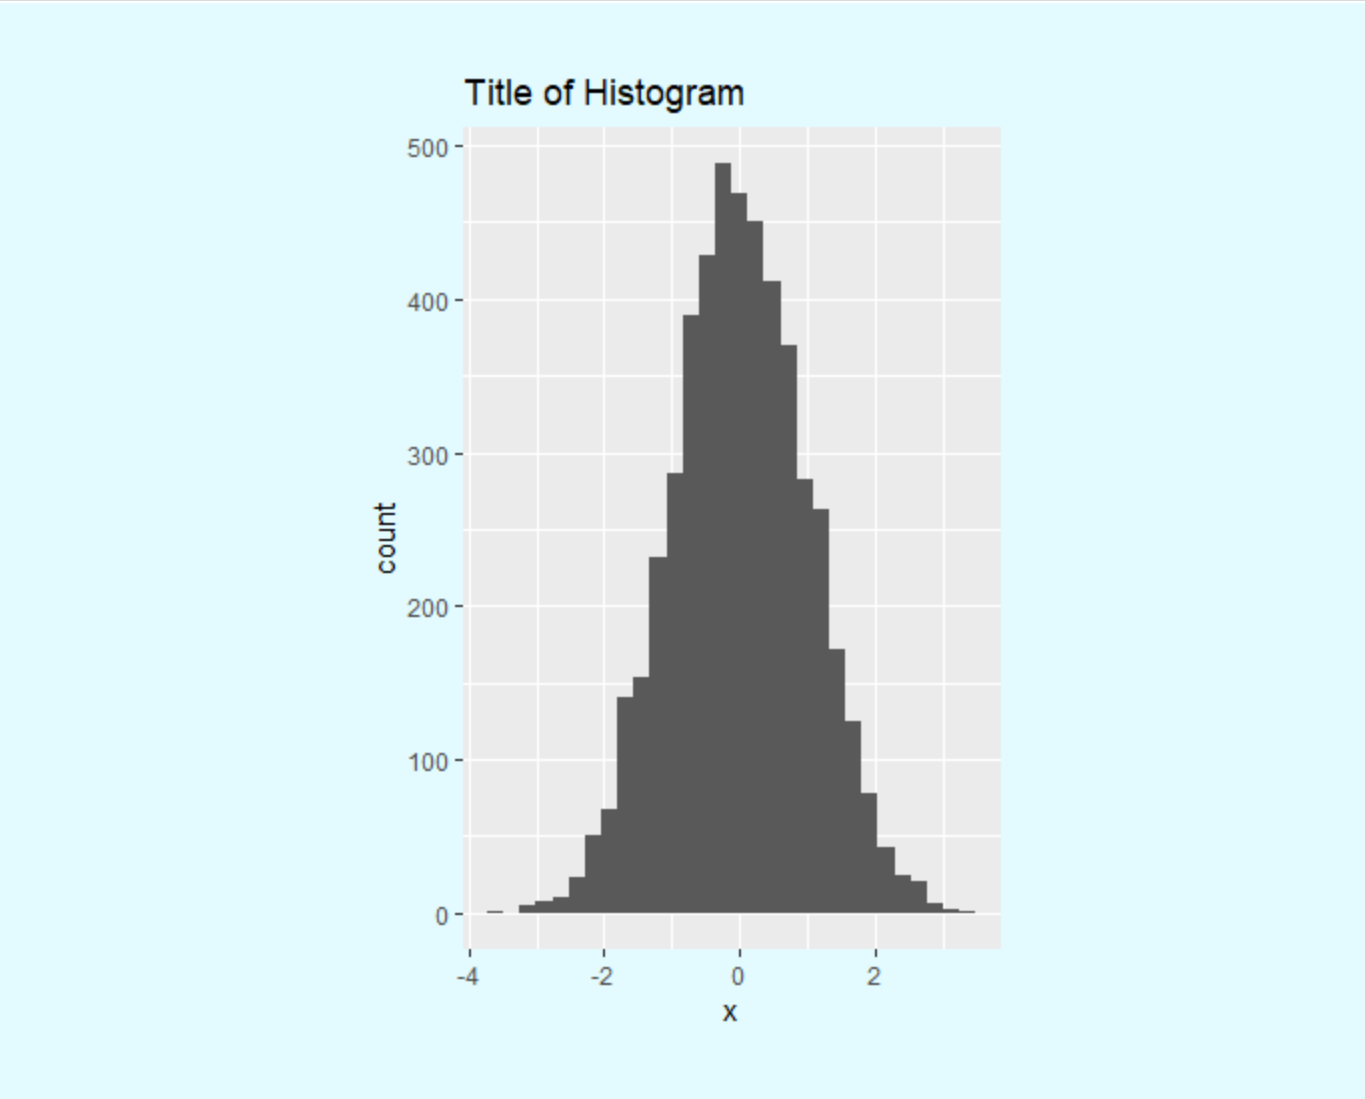
สังเกตว่ามีพื้นที่ด้านซ้ายและขวาของแปลงเยอะ
แหล่งข้อมูลเพิ่มเติม
บทช่วยสอนต่อไปนี้จะอธิบายวิธีดำเนินการทั่วไปอื่นๆ ใน ggplot2:
วิธีเปลี่ยนขนาดตัวอักษรใน ggplot2
วิธีหมุนป้ายกำกับแกนใน ggplot2
วิธีลบคำอธิบายแผนภูมิใน ggplot2
วิธีลบป้ายกำกับแกนใน ggplot2