วิธีการวาดลูกศรใน ggplot2 (พร้อมตัวอย่าง)
คุณสามารถใช้ไวยากรณ์พื้นฐานต่อไปนี้เพื่อวาดลูกศรในพล็อตใน ggplot2:
 library (ggplot2)

ggplot(df, aes(x=x, y=y)) +
  geom_point() +
  geom_segment(aes(x= 5 , y= 6 , xend= 8 , yend= 9 ), arrow = arrow(length=unit( 0.5 , ' cm ')))
ต่อไปนี้คือสิ่งที่แต่ละอาร์กิวเมนต์ทำในฟังก์ชัน geom_segment() :
- x : ค่า x ที่จะเริ่มต้น
- y : ค่า y ที่จะเริ่มต้น
- xend : ค่า x ที่จะสิ้นสุดที่
- เยนด์ : ค่า y ที่จะสิ้นสุดที่
- arrow : ความยาวของปลายลูกศร
ตัวอย่างต่อไปนี้แสดงวิธีการวาดลูกศรโดยใช้ ggplot2 ในทางปฏิบัติ
ตัวอย่าง: การวาดลูกศรใน ggplot2
สมมติว่าเรามีฐานข้อมูลต่อไปนี้ซึ่งมีข้อมูลเกี่ยวกับจำนวนคะแนนที่ทำได้และการรีบาวด์ที่รวบรวมโดยผู้เล่นบาสเกตบอลต่างๆ:
 #create data frame
df <- data. frame (points=c(3, 3, 5, 6, 7, 8, 9, 9, 8, 5),
                 rebounds=c(2, 6, 5, 5, 8, 5, 9, 9, 8, 6))

#view data frame
df

   rebound points
1 3 2
2 3 6
3 5 5
4 6 5
5 7 8
6 8 5
7 9 9
8 9 9
9 8 8
10 5 6
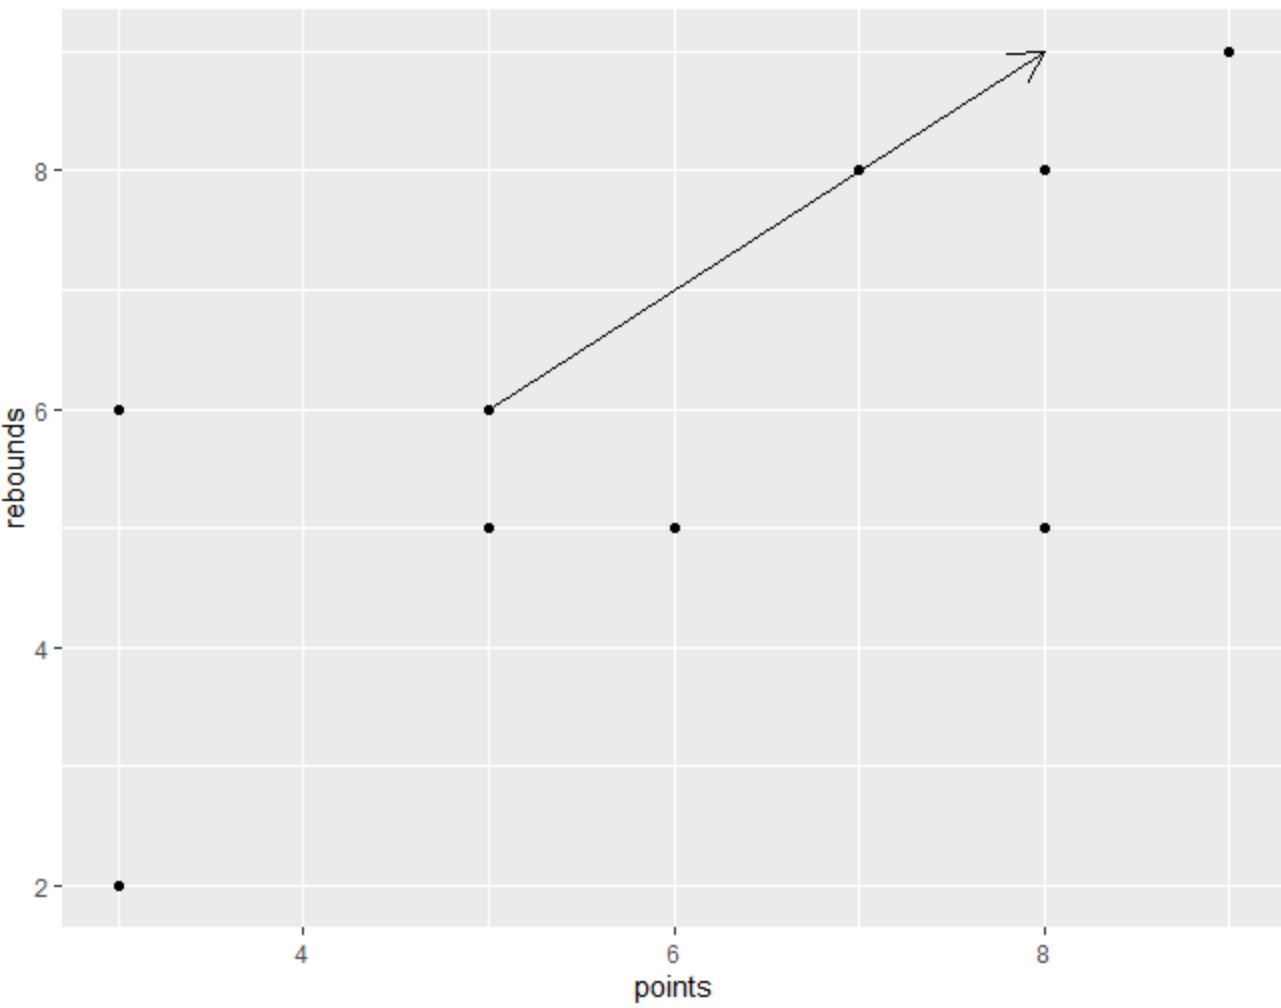
เราสามารถใช้ไวยากรณ์ต่อไปนี้เพื่อสร้าง Scatterplot ใน ggplot2 และเพิ่มลูกศรที่ตำแหน่งเฉพาะบนพล็อต:
 library (ggplot2)

#create scatterplot and add arrow
ggplot(df, aes(x=points, y=rebounds)) +
  geom_point() +
  geom_segment(aes(x= 5 , y= 6 , xend= 8 , yend= 9 ), arrow = arrow(length=unit( .5 , ' cm ')))

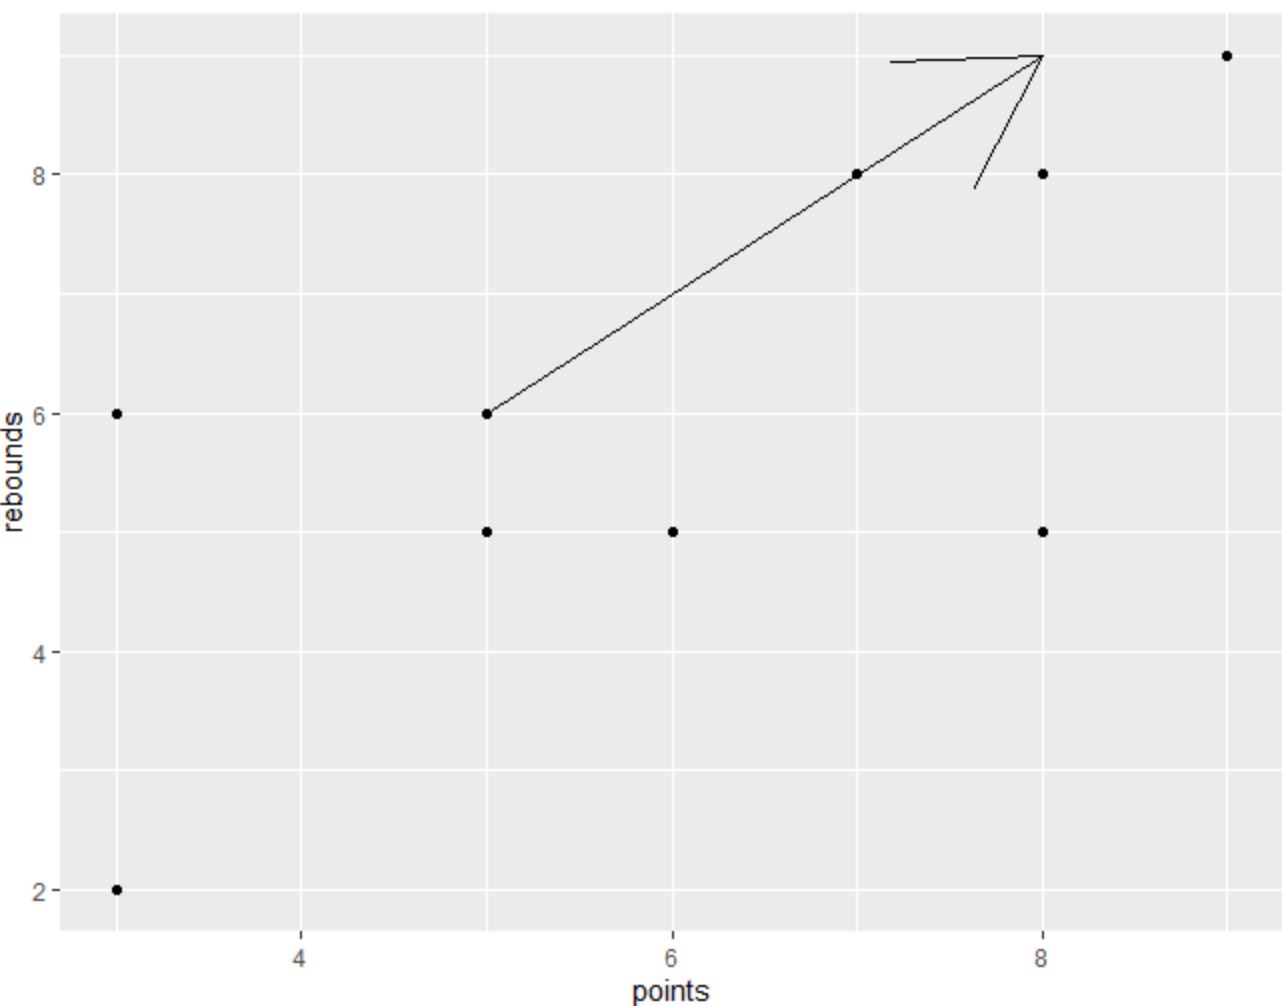
อย่าลังเลที่จะเปลี่ยนค่าในฟังก์ชัน ลูกศร () เพื่อเพิ่มหรือลดขนาดของหัวลูกศร
ตัวอย่างเช่น รหัสต่อไปนี้แสดงวิธีการเพิ่มขนาด:
 library (ggplot2)

#create scatterplot and add arrow with increased arrow head size
ggplot(df, aes(x=points, y=rebounds)) +
  geom_point() +
  geom_segment(aes(x= 5 , y= 6 , xend= 8 , yend= 9 ), arrow = arrow(length=unit( 2 , ' cm ')))

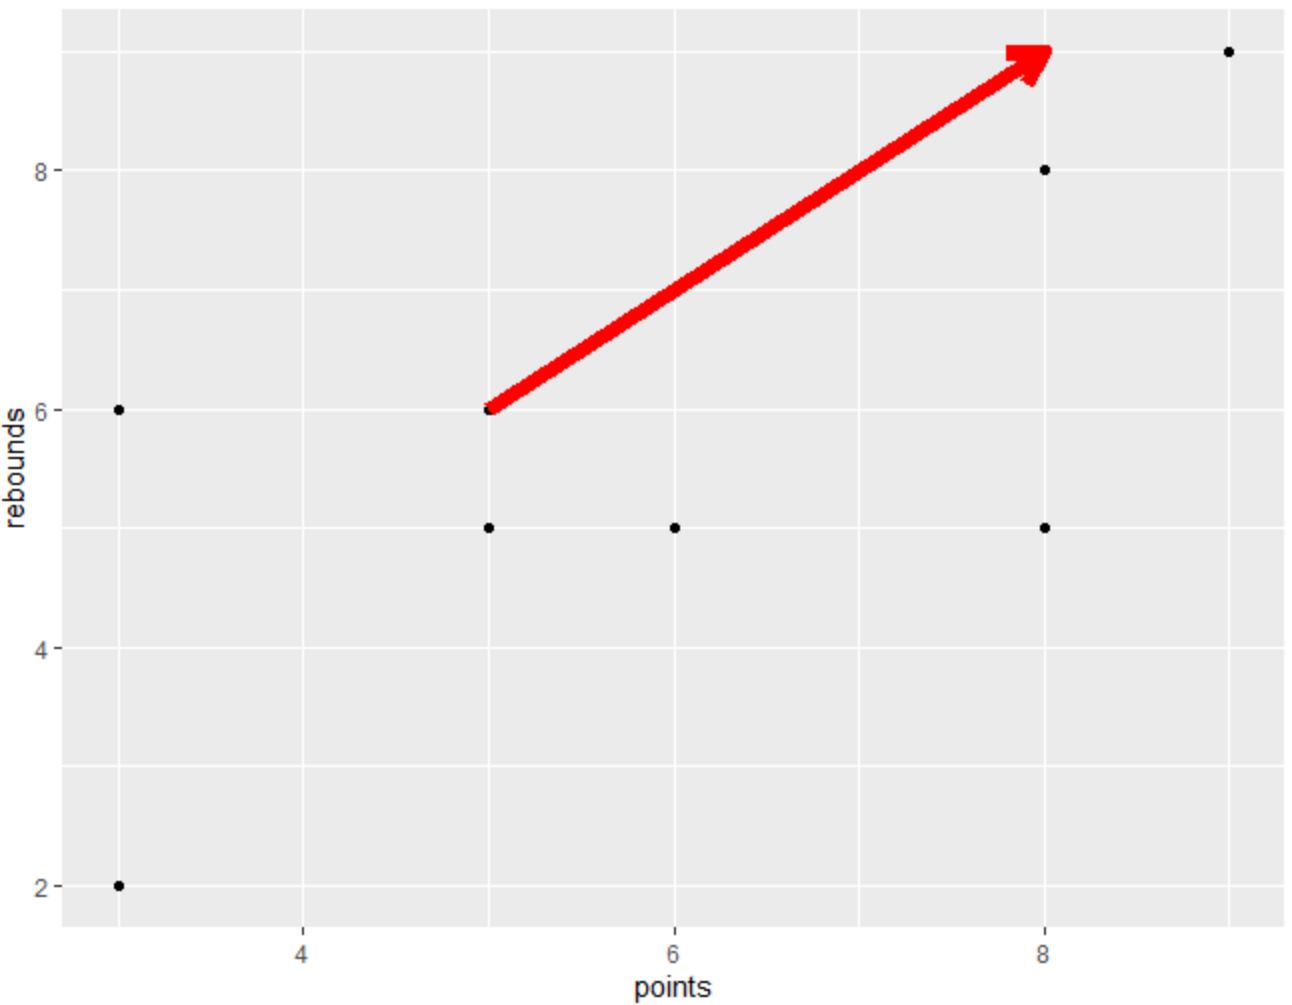
คุณยังสามารถใช้อาร์กิวเมนต์ สี และ lwd เพื่อเปลี่ยนสีและความกว้างของเส้นของลูกศรตามลำดับ:
 library (ggplot2)

#create scatterplot and add customized arrow
ggplot(df, aes(x=points, y=rebounds)) +
  geom_point() +
  geom_segment(aes(x= 5 , y= 6 , xend= 8 , yend= 9 ), arrow = arrow(length=unit( .5 , ' cm ')),
               color=' red ', lwd= 3 )

อย่าลังเลที่จะเล่นกับอาร์กิวเมนต์ต่างๆ ของฟังก์ชัน geom_segment() เพื่อสร้างลูกศรที่ดูเหมือนที่คุณต้องการทุกประการ
แหล่งข้อมูลเพิ่มเติม
บทช่วยสอนต่อไปนี้จะอธิบายวิธีดำเนินการงานทั่วไปอื่นๆ ใน ggplot2:
วิธีลบเส้นตารางใน ggplot2
วิธีแรเงาพื้นที่ใน ggplot2
วิธีเปลี่ยนป้ายกำกับแกน X ใน ggplot2