วิธีการวาดลูกศรใน matplotlib
หากต้องการวาดลูกศรใน Matplotlib คุณสามารถใช้ ฟังก์ชัน matplotlib.pyplot.arrow ซึ่งใช้ไวยากรณ์ต่อไปนี้:
matplotlib.pyplot.arrow(x, y, dx, dy)
ทอง:
- x, y: พิกัด x และ y ของฐานลูกศร
- dx, dy: ความยาวของลูกศรในทิศทาง x และ y
บทช่วยสอนนี้มีตัวอย่างการใช้งานฟังก์ชันนี้ในทางปฏิบัติหลายตัวอย่าง
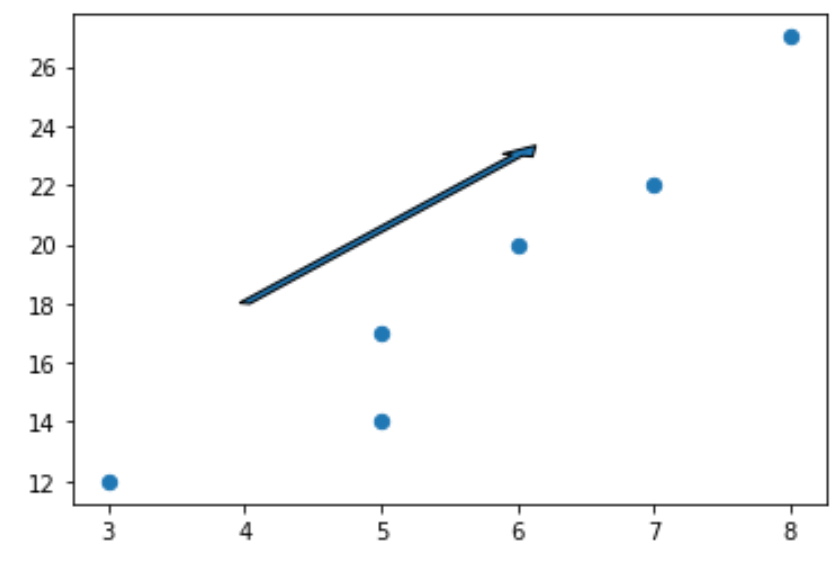
ตัวอย่างที่ 1: วาดลูกศรเพียงอันเดียว
รหัสต่อไปนี้แสดงวิธีการวาดลูกศรเดียวบนพล็อต Matplotlib:
 import matplotlib. pyplot as plt

#define two arrays for plotting
A = [3, 5, 5, 6, 7, 8]
B = [12, 14, 17, 20, 22, 27]

#create scatterplot, specifying marker size to be 40
plt. scatter (A, B, s= 40 )

#add arrow to plot
plt. arrow (x= 4 , y= 18 , dx= 2 , dy= 5 , width= .08 )

#displayplot
plt. show ()
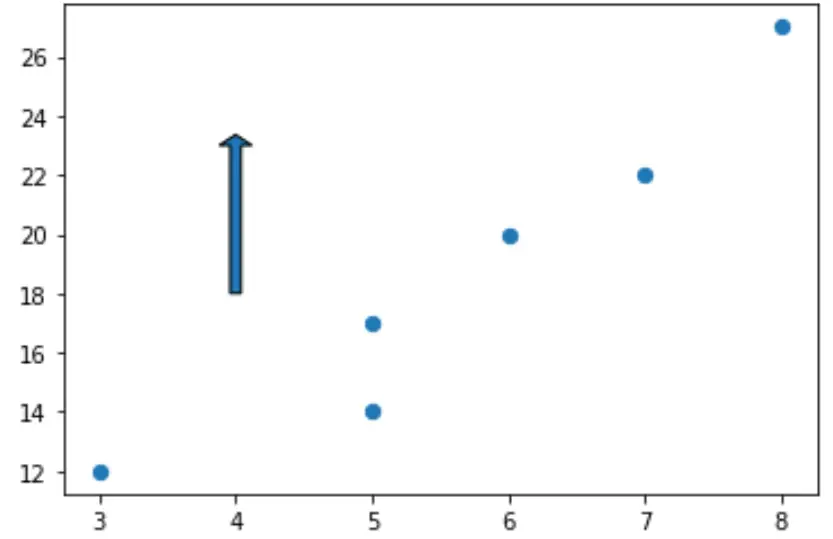
โปรดทราบว่าเราสามารถตั้งค่า dx=0 เพื่อสร้างลูกศรแนวตั้ง และ dy=0 เพื่อสร้างลูกศรแนวนอน
ตัวอย่างเช่น ต่อไปนี้เป็นวิธีสร้างลูกศรแนวตั้ง:
 import matplotlib. pyplot as plt

#define two arrays for plotting
A = [3, 5, 5, 6, 7, 8]
B = [12, 14, 17, 20, 22, 27]

#create scatterplot, specifying marker size to be 40
plt. scatter (A, B, s= 40 )

#add arrow to plot
plt. arrow (x= 4 , y= 18 , dx= 0 , dy= 5 , width= .08 )

#displayplot
plt. show ()
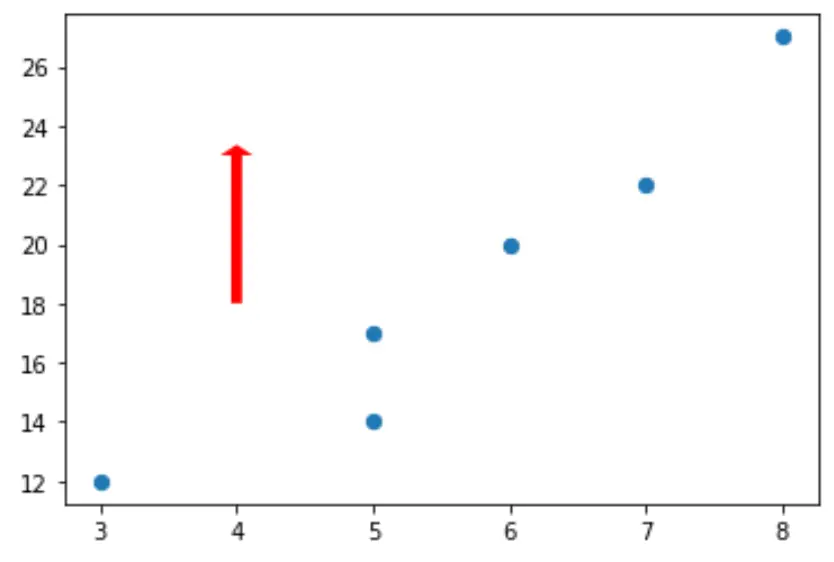
ตัวอย่างที่ 2: จัดสไตล์ลูกศร
ตามค่าเริ่มต้น ลูกศรใน Matplotlib จะเป็นสีน้ำเงินและมีขอบสีดำ แต่เราสามารถเปลี่ยนได้อย่างง่ายดายโดยใช้อาร์กิวเมนต์ facecolor และ edgecolor :
 import matplotlib. pyplot as plt

#define two arrays for plotting
A = [3, 5, 5, 6, 7, 8]
B = [12, 14, 17, 20, 22, 27]

#create scatterplot, specifying marker size to be 40
plt. scatter (A, B, s= 40 )

#add arrow to plot
plt. arrow (x= 4 , y= 18 , dx= 0 , dy= 5 , width= .08 , facecolor= 'red' , edgecolor= 'none' )

#displayplot
plt. show ()
คุณสามารถดูรายการคุณสมบัติสไตล์ทั้งหมดที่สามารถนำไปใช้กับลูกศรได้ ที่นี่
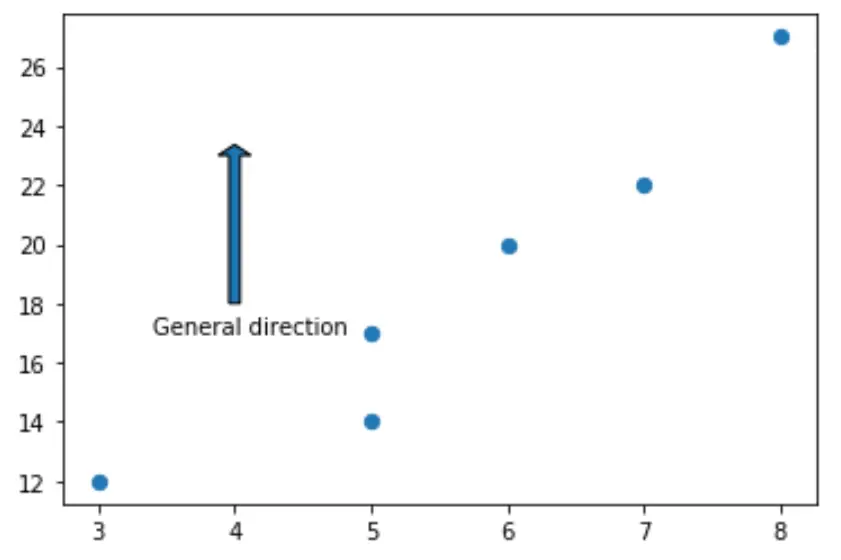
ตัวอย่างที่ 3: เพิ่มคำอธิบายประกอบให้กับลูกศร
รหัสต่อไปนี้แสดงวิธีการเพิ่มคำอธิบายประกอบใต้ลูกศรบนพล็อต Matplotlib:
 import matplotlib. pyplot as plt

#define two arrays for plotting
A = [3, 5, 5, 6, 7, 8]
B = [12, 14, 17, 20, 22, 27]

#create scatterplot, specifying marker size to be 40
plt. scatter (A, B, s= 40 )

#add arrow to plot
plt. arrow (x= 4 , y= 18 , dx= 0 , dy= 5 , width= .08 )

#add annotation
plt. annotate (' General direction ', xy = (3.4, 17))

#displayplot
plt. show ()
แหล่งข้อมูลเพิ่มเติม
วิธีพล็อตวงกลมใน Matplotlib (พร้อมตัวอย่าง)
วิธีการวาดรูปสี่เหลี่ยมใน Matplotlib (พร้อมตัวอย่าง)
เกี่ยวกับผู้แต่ง
ดร.เบนจามิน แอนเดอร์สัน
สวัสดี ฉันชื่อเบนจามิน ศาสตราจารย์สถิติเกษียณอายุแล้ว และผันตัวมาเป็นครูสอนสถิติโดยเฉพาะ ด้วยประสบการณ์และความเชี่ยวชาญที่กว้างขวางในสาขาสถิติ ฉันกระตือรือร้นที่จะแบ่งปันความรู้ของฉันเพื่อเสริมศักยภาพนักเรียนผ่าน Statorials. รู้เพิ่มเติม