วิธีพล็อตวงกลมใน matplotlib (พร้อมตัวอย่าง)
คุณสามารถเพิ่มวงกลมลงในพล็อตใน Matplotlib ได้อย่างรวดเร็วโดยใช้ฟังก์ชัน Circle() ซึ่งใช้ไวยากรณ์ต่อไปนี้:
matplotlib.patches.Circle (xy, รัศมี = 5)
ทอง:
- xy: พิกัด (x, y) ของวงกลม
- รัศมี: รัศมีของวงกลม ค่าเริ่มต้นคือ 5
บทช่วยสอนนี้แสดงตัวอย่างการใช้งานฟังก์ชันนี้ในทางปฏิบัติหลายประการ:
ตัวอย่างที่ 1: สร้างวงกลมเดี่ยว
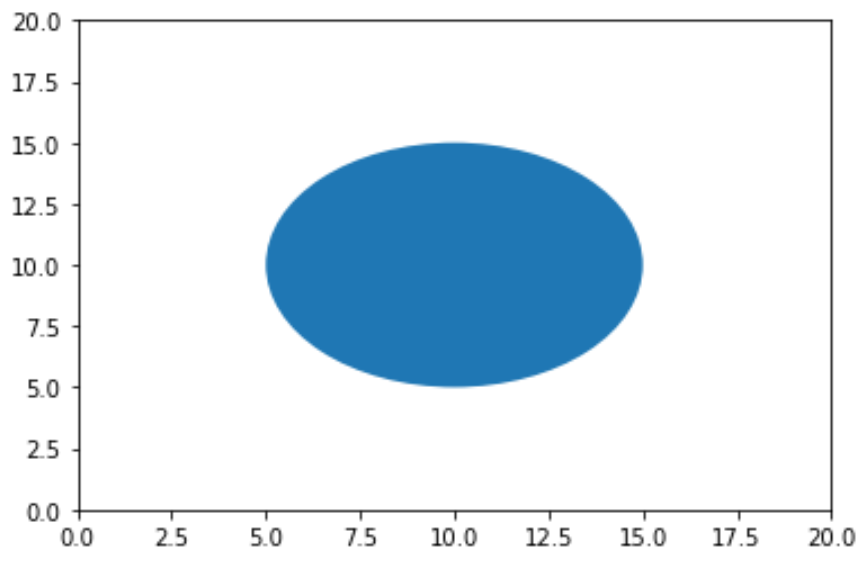
รหัสต่อไปนี้แสดงวิธีการสร้างวงกลมเดี่ยวบนพล็อต Matplotlib ซึ่งอยู่ที่พิกัด (x,y)(10,10):
 import matplotlib. pyplot as plt

#set axis limits of plot (x=0 to 20, y=0 to 20)
plt. axis ([0, 20, 0, 20])

#create circle with (x, y) coordinates at (10, 10)
c=plt. Circle ((10, 10))

#add circle to plot (gca means "get current axis")
plt. gca (). add_artist (c)

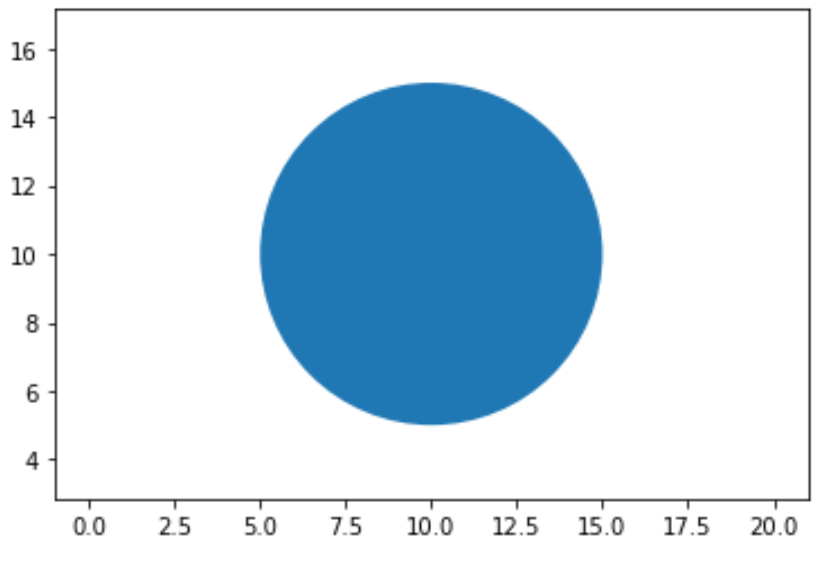
ตามค่าเริ่มต้น แกนของพล็อต Matplotlib โดยทั่วไปจะแสดงพิกเซลต่อหน่วยข้อมูลมากขึ้น หากต้องการให้วงกลมปรากฏเป็นวงกลมแทนที่จะเป็นวงรี คุณต้องใช้อาร์กิวเมนต์ plt.axis(“equal”) ดังนี้:
 import matplotlib. pyplot as plt

#set axis limits of plot (x=0 to 20, y=0 to 20)
plt. axis ([0, 20, 0, 20])
plt. axis (" equal ")

#create circle with (x, y) coordinates at (10, 10)
c=plt. Circle ((10, 10))

#add circle to plot (gca means "get current axis")
plt. gca (). add_artist (c)

ตัวอย่างที่ 2: สร้าง แวดวงหลายแวดวง
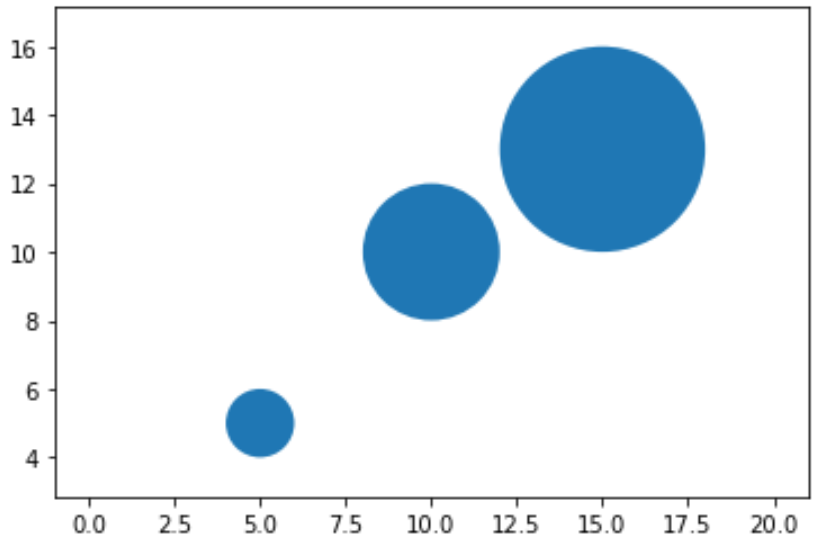
รหัสต่อไปนี้แสดงวิธีสร้างวงกลมหลายวงบนพล็อต Matplotlib:
 import matplotlib. pyplot as plt

#set axis limits of plot (x=0 to 20, y=0 to 20)
plt. axis ([0, 20, 0, 20])
plt. axis (" equal ")

#define circles
c1=plt. Circle ((5, 5), radius= 1 )
c2=plt. Circle ((10, 10), radius= 2 )
c3=plt. Circle ((15, 13), radius= 3 )

#add circles to plot
plt. gca (). add_artist (c1)
plt. gca (). add_artist (c2)
plt. gca (). add_artist (c3)

ตัวอย่างที่ 3: เปลี่ยนลักษณะของวงกลม
คุณสามารถใช้อาร์กิวเมนต์ต่อไปนี้เพื่อเปลี่ยนลักษณะของวงกลมใน Matplotlib:
- รัศมี: ระบุรัศมีของวงกลม
- สี : ระบุสีของวงกลม
- alpha: ระบุความโปร่งใสของวงกลม
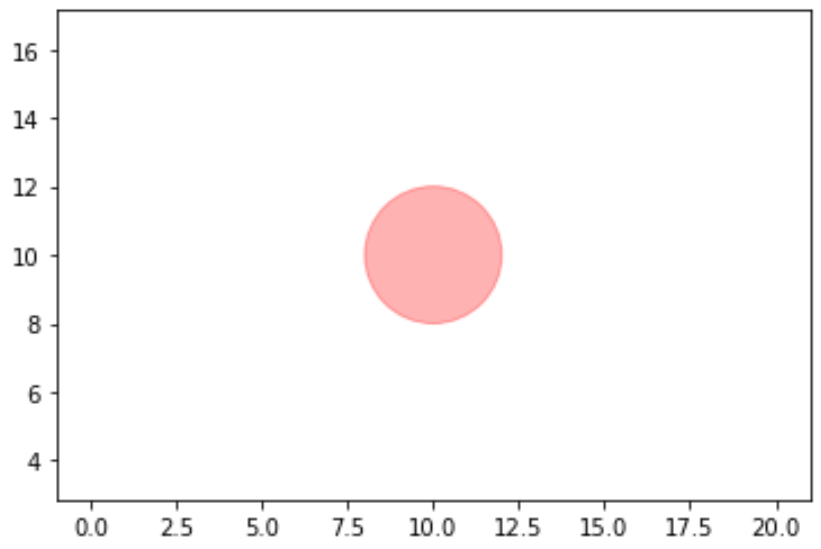
รหัสต่อไปนี้แสดงตัวอย่างวิธีใช้อาร์กิวเมนต์เหล่านี้หลายรายการพร้อมกัน:
 import matplotlib. pyplot as plt

#set axis limits of plot (x=0 to 20, y=0 to 20)
plt. axis ([0, 20, 0, 20])
plt. axis (" equal ")

#create circle with (x, y) coordinates at (10, 10)
c=plt. Circle ((10, 10), radius= 2 , color=' red ', alpha= .3 )

#add circle to plot (gca means "get current axis")
plt. gca (). add_artist (c)

โปรดทราบว่าคุณยังสามารถใช้รหัสสีเลขฐานสิบหกแบบกำหนดเองเพื่อระบุสีของวงกลมได้