วิธีเปลี่ยนสีพื้นหลังใน ggplot2 (พร้อมตัวอย่าง)
คุณสามารถใช้ไวยากรณ์ต่อไปนี้เพื่อเปลี่ยนสีพื้นหลังขององค์ประกอบต่างๆ ในพล็อต ggplot2:
 p + theme(panel. background = element_rect(fill = ' lightblue ', color = ' purple '),
          panel. grid . major = element_line(color = ' red ', linetype = ' dotted '),
          panel. grid . minor = element_line(color = ' green ', size = 2 ))
คุณยังสามารถใช้ธีม ggplot2 ในตัวเพื่อเปลี่ยนสีพื้นหลังโดยอัตโนมัติได้ ต่อไปนี้คือธีมบางส่วนที่ใช้บ่อยที่สุด:
 p + theme_bw() #white background and gray gridlines
p + theme_minimal() #no background annotations
p + theme_classic() #axis lines but no gridlines
ตัวอย่างต่อไปนี้แสดงวิธีใช้ไวยากรณ์นี้ในทางปฏิบัติ
ตัวอย่างที่ 1: ระบุสีพื้นหลังที่กำหนดเอง
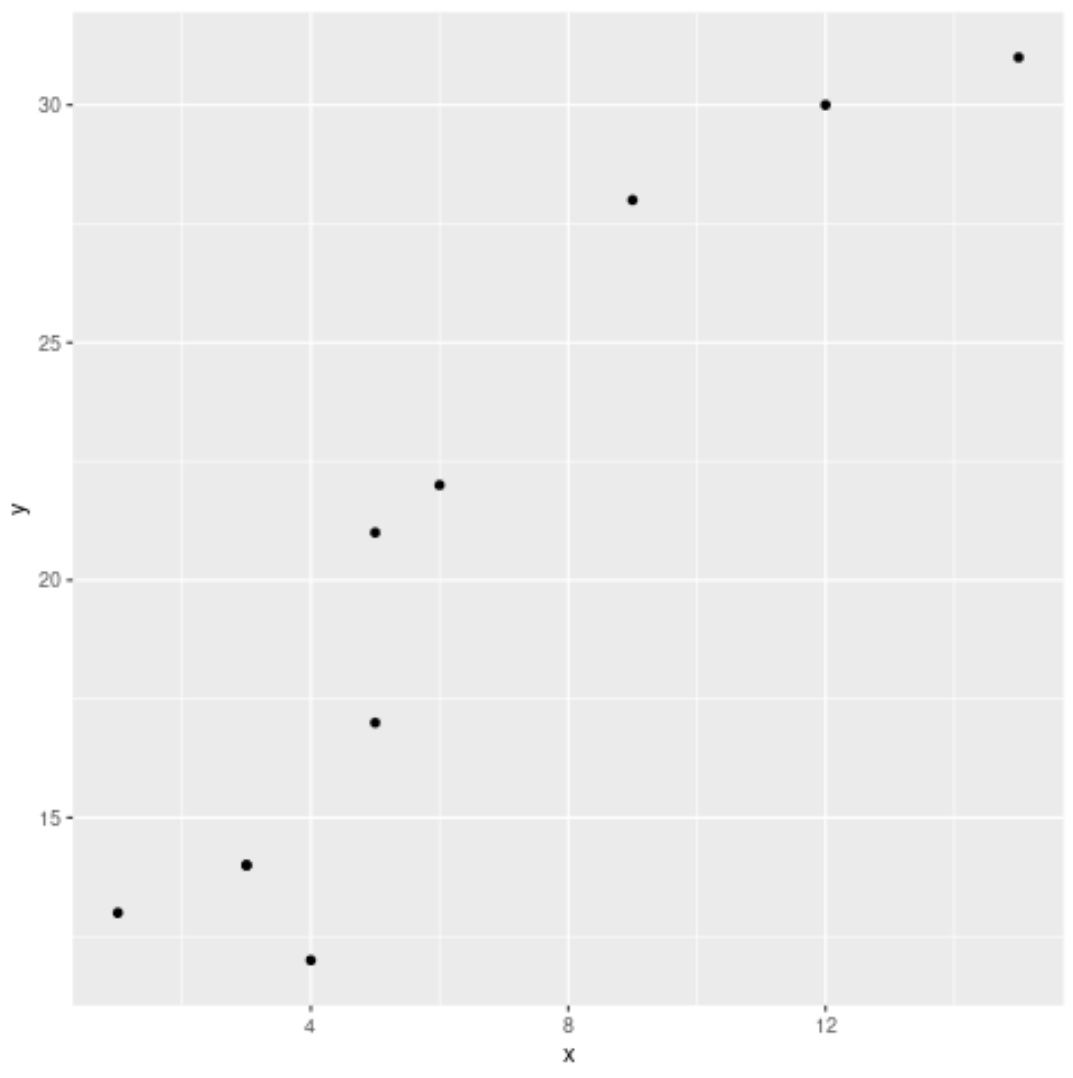
รหัสต่อไปนี้แสดงวิธีสร้าง Scatterplot พื้นฐานใน ggplot2 โดยมีพื้นหลังสีเทาเริ่มต้น:
 library (ggplot2)

#create data frame
df <- data. frame (x=c(1, 3, 3, 4, 5, 5, 6, 9, 12, 15),
                 y=c(13, 14, 14, 12, 17, 21, 22, 28, 30, 31))

#create scatterplot
p <- ggplot(df, aes (x=x, y=y)) +
       geom_point()

#display scatterplot
p
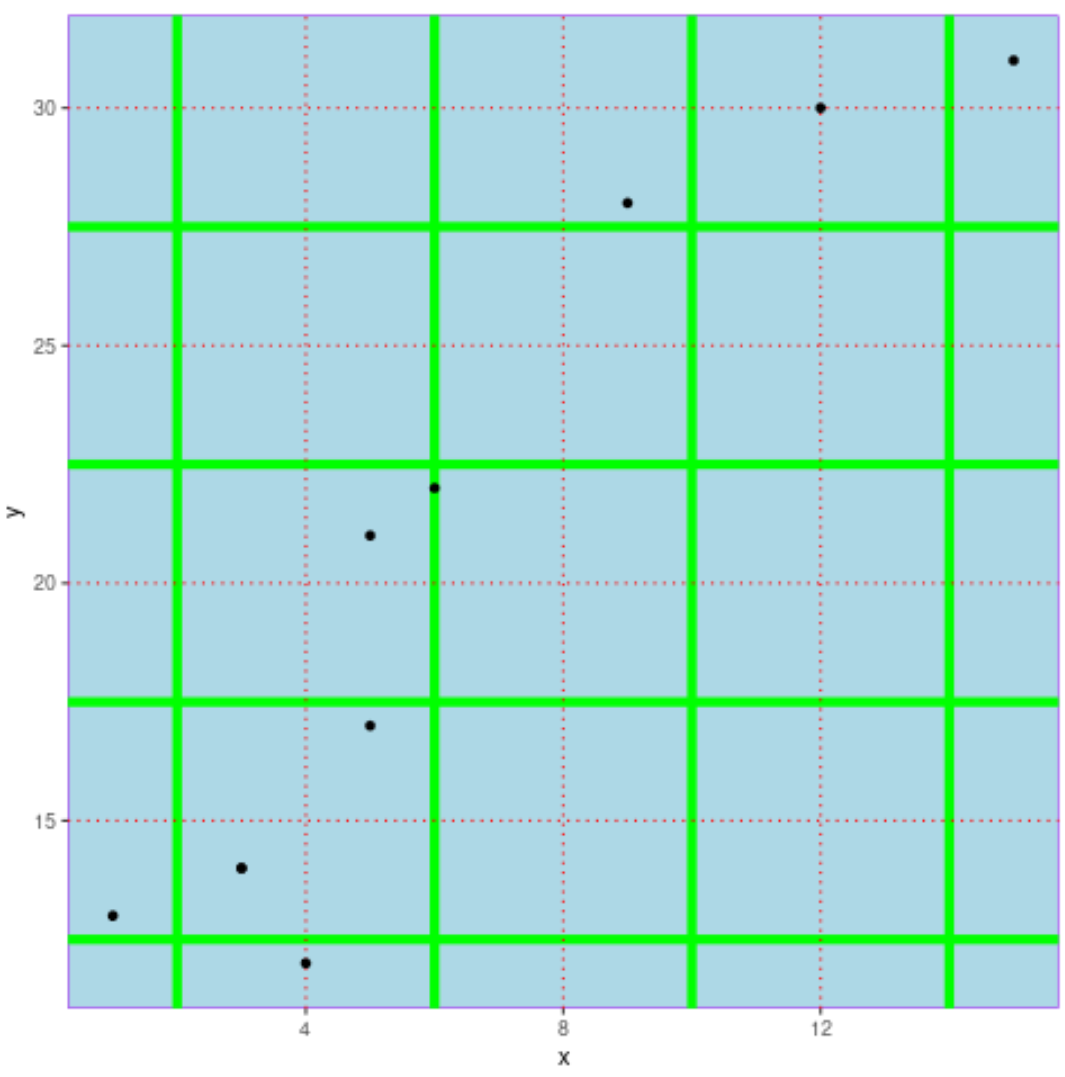
เราสามารถใช้โค้ดต่อไปนี้เพื่อเปลี่ยนสีพื้นหลังของพาเนลตลอดจนเส้นตารางหลักและเส้นรอง:
 p + theme(panel. background = element_rect(fill = ' lightblue ', color = ' purple '),
          panel. grid . major = element_line(color = ' red ', linetype = ' dotted '),
          panel. grid . minor = element_line(color = ' green ', size = 2 ))
ตัวอย่างที่ 2: ใช้ธีมในตัวเพื่อเปลี่ยนสีพื้นหลัง
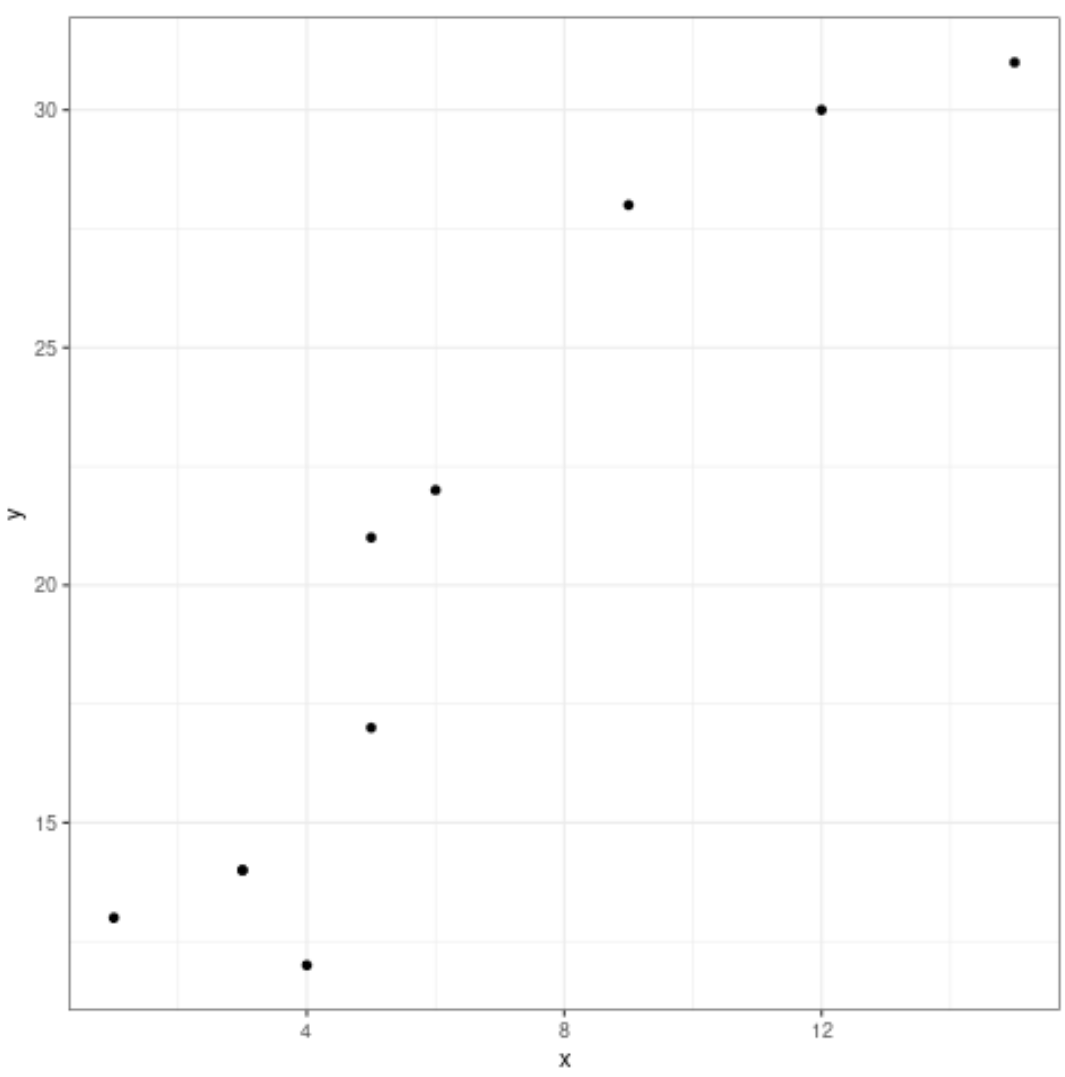
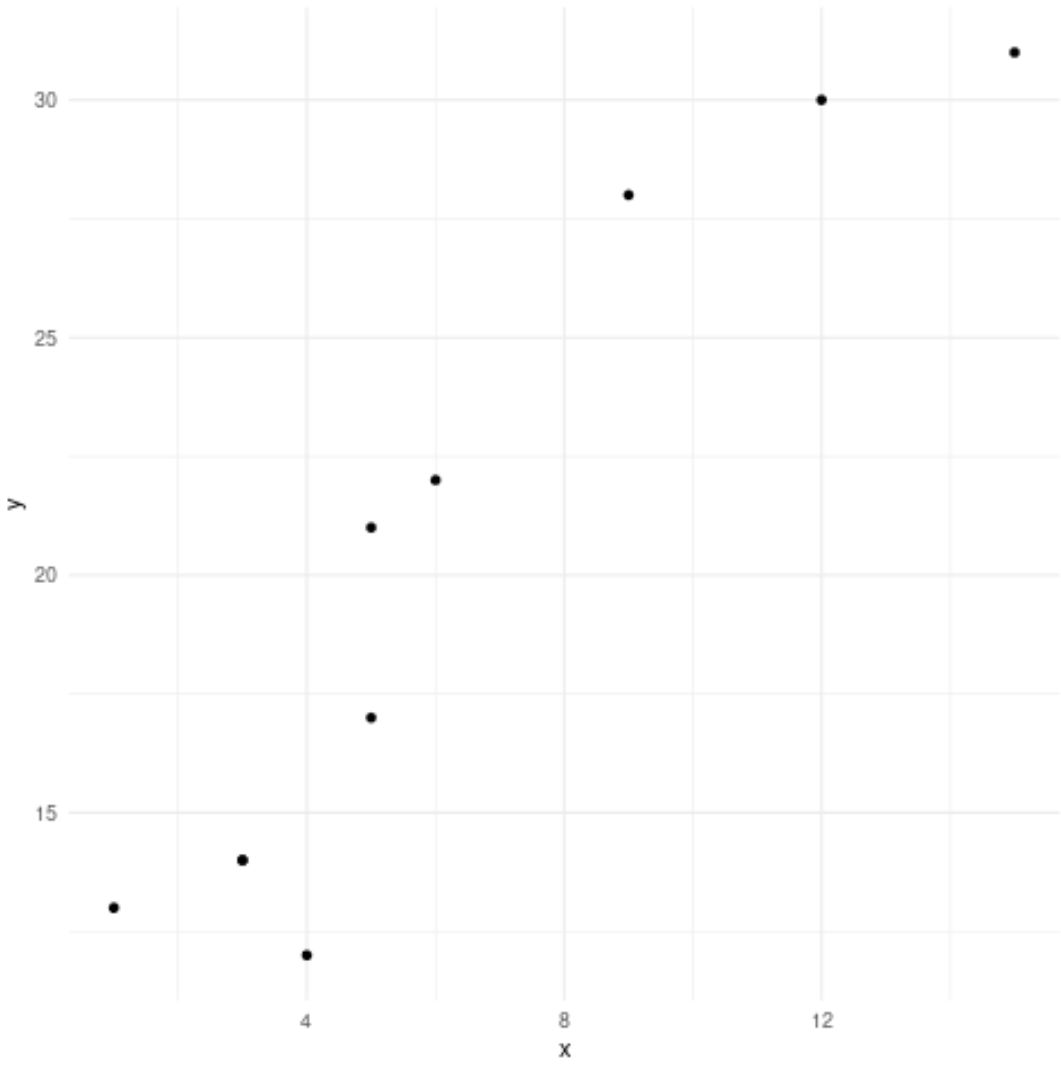
รหัสต่อไปนี้สาธิตวิธีใช้ธีม ggplot2 ในตัวต่างๆ เพื่อเปลี่ยนสีพื้นหลังของแปลงโดยอัตโนมัติ:
p + theme_bw() #white background and gray gridlines
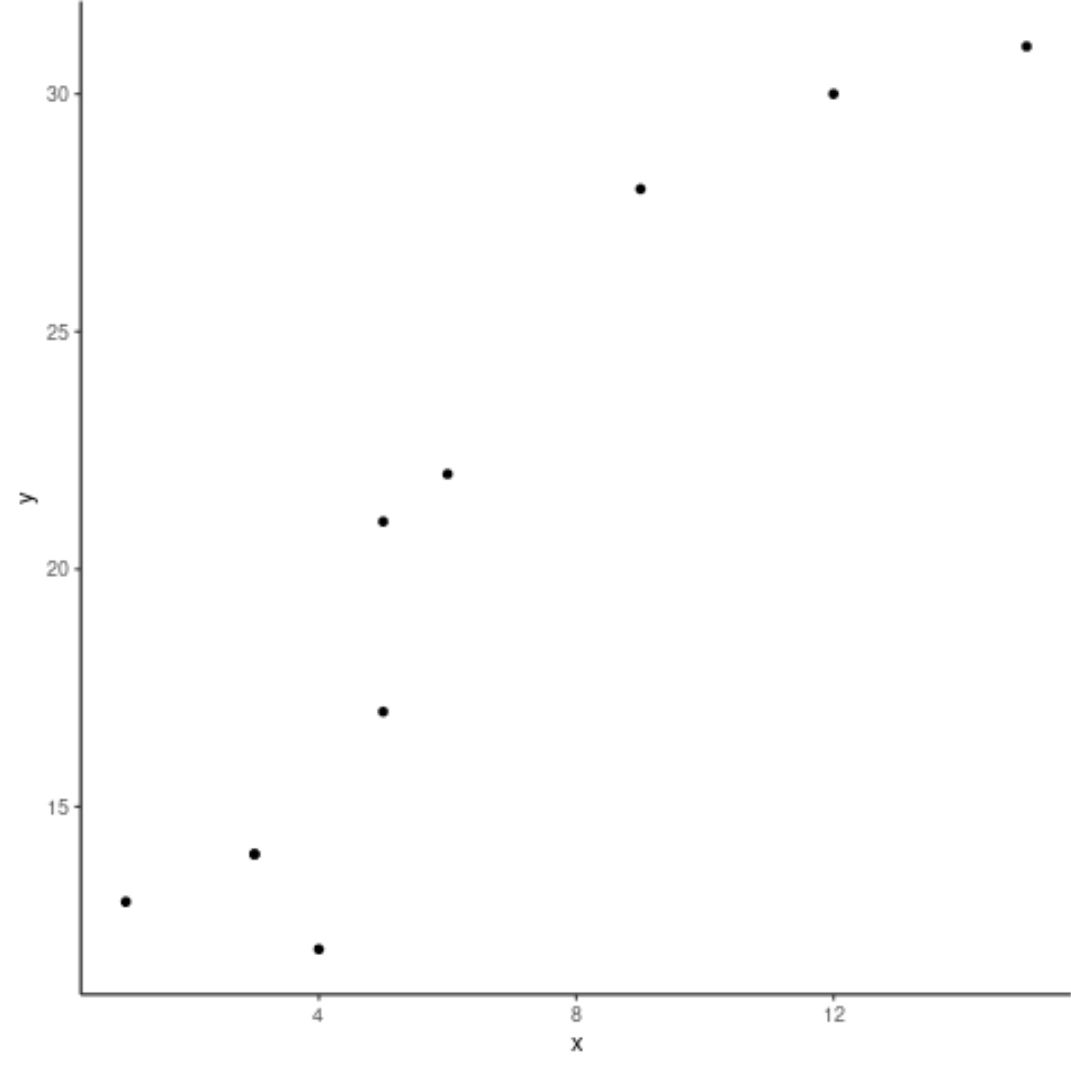
p + theme_minimal() #no background annotations
p + theme_classic() #axis lines but no gridlines
แหล่งข้อมูลเพิ่มเติม
วิธีลบเส้นตารางใน ggplot2
วิธีตั้งค่าขีดจำกัดแกนใน ggplot2
วิธีเปลี่ยนตำแหน่งคำอธิบายแผนภูมิใน ggplot2