วิธีตั้งค่าอัตราส่วนภาพใน matplotlib
อัตราส่วนภาพ ของพล็อต Matplotlib อ้างอิงถึงลักษณะของมาตราส่วนแกน ซึ่งก็คืออัตราส่วนของหน่วย y ต่อหน่วย x
อัตราส่วนนี้สามารถแก้ไขได้โดยใช้ฟังก์ชัน matplotlib.axes.Axes.set_aspect()
ภายใต้ประทุน ฟังก์ชัน set_aspect() จะเปลี่ยนสิ่งที่เรียกว่า data Coordinate System แต่ในทางปฏิบัติ เรามักจะต้องการเปลี่ยน Display Coordinate System
เพื่ออำนวยความสะดวกในการแปลงนี้ เราสามารถใช้โค้ดนี้:
 #define y-unit to x-unit ratio
ratio = 1.0

#get x and y limits
x_left, x_right = ax. get_xlim ()
y_low, y_high = ax. get_ylim ()

#set aspect ratio
ax. set_aspect ( abs ((x_right-x_left)/(y_low-y_high))*ratio)
มาดูตัวอย่างการใช้ฟังก์ชันนี้ในทางปฏิบัติกัน
ขั้นตอนที่ 1: สร้างพล็อต Matplotlib พื้นฐาน
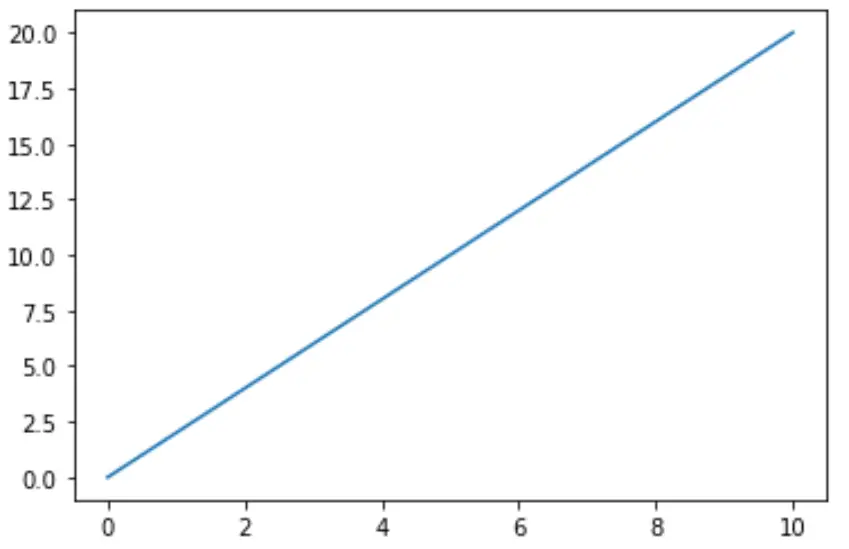
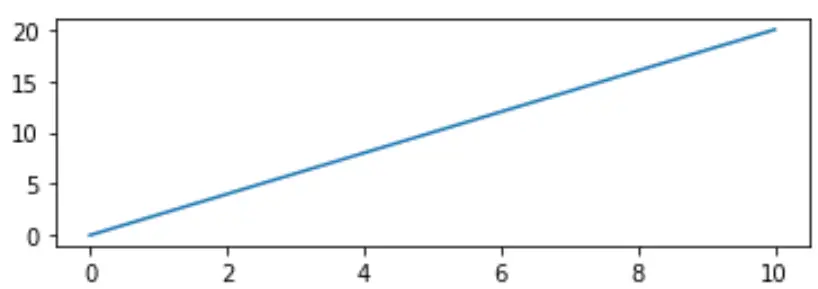
ขั้นแรก เรามาสร้างแผนภูมิเส้นอย่างง่ายโดยใช้ Matplotlib:
 import matplotlib.pyplot as plt

#define matplotlib figure and axis
fig, ax = plt. subplots ()

#create simple line plot
ax. plot ([0, 10],[0, 20])

#displayplot
plt. show ()
ขั้นตอนที่ 2: ตั้งค่าอัตราส่วนภาพ (ผิดวิธี)
โปรดทราบว่าแกน x ยาวกว่าแกน y ลองตั้งค่าอัตราส่วนภาพเป็น 1 นั่นคือแกน x และแกน y ควรเท่ากัน:
 import matplotlib.pyplot as plt

#define matplotlib figure and axis
fig, ax = plt. subplots ()

#create simple line plot
ax. plot ([0, 10],[0, 20])

#attempt to set aspect ratio to 1
ax. set_aspect (1)

#displayplot
plt. show ()
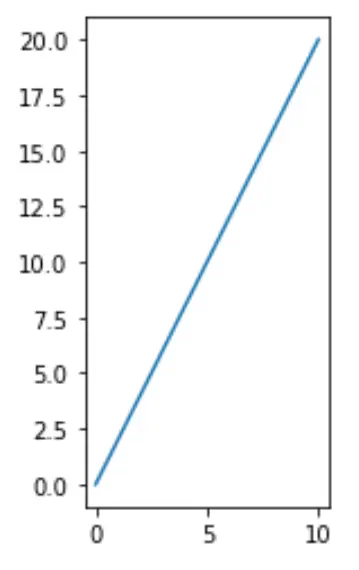
โปรดทราบว่าสิ่งนี้ไม่ได้ผลตามที่คาดไว้ แกน y ยาวกว่าแกน x มาก
ขั้นตอนที่ 3: ตั้งค่าอัตราส่วนภาพ (วิธีที่ถูกต้อง)
รหัสต่อไปนี้แสดงวิธีการใช้การคำนวณอย่างง่ายเพื่อตั้งค่าอัตราส่วนที่ถูกต้อง:
 import matplotlib.pyplot as plt

#define matplotlib figure and axis
fig, ax = plt. subplots ()

#create simple line plot
ax. plot ([0, 10],[0, 20])

#set aspect ratio to 1
ratio = 1.0
x_left, x_right = ax. get_xlim ()
y_low, y_high = ax. get_ylim ()
ax. set_aspect ( abs ((x_right-x_left)/(y_low-y_high))*ratio)

#displayplot
plt. show ()
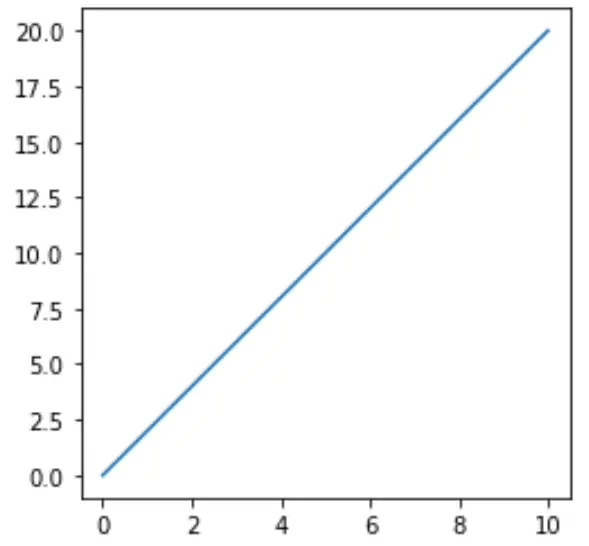
โปรดทราบว่าโครงเรื่องนี้มีอัตราส่วนภาพที่เราคาดไว้ แกน x และแกน y มีความยาวเท่ากัน
ขั้นตอนที่ 4: ปรับอัตราส่วนภาพตามที่คุณต้องการ
หากเราต้องการให้แกน y ยาวกว่าแกน x เราก็สามารถระบุได้ว่าอัตราส่วนกว้างยาวเป็นตัวเลขที่มากกว่า 1:
 import matplotlib.pyplot as plt

#define matplotlib figure and axis
fig, ax = plt. subplots ()

#create simple line plot
ax. plot ([0, 10],[0, 20])

#set aspect ratio to 3
ratio = 3
x_left, x_right = ax. get_xlim ()
y_low, y_high = ax. get_ylim ()
ax. set_aspect ( abs ((x_right-x_left)/(y_low-y_high))*ratio)

#displayplot
plt. show ()
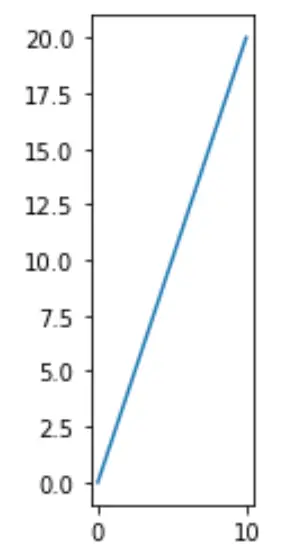
และถ้าเราต้องการให้แกน y สั้นกว่าแกน x เราก็สามารถระบุได้ว่าอัตราส่วนภาพเป็นตัวเลขที่น้อยกว่า 1:
 import matplotlib.pyplot as plt

#define matplotlib figure and axis
fig, ax = plt. subplots ()

#create simple line plot
ax. plot ([0, 10],[0, 20])

#set aspect ratio to .3
ratio = .3
x_left, x_right = ax. get_xlim ()
y_low, y_high = ax. get_ylim ()
ax. set_aspect ( abs ((x_right-x_left)/(y_low-y_high))*ratio)

#displayplot
plt. show ()
คุณสามารถค้นหาบทช่วยสอน Matplotlib เพิ่มเติม ได้ที่นี่