วิธีการสร้างแปลง seaborn หลายแปลงในรูปเดียว
คุณสามารถใช้ฟังก์ชัน FacetGrid() เพื่อสร้างแปลง Seaborn หลายแปลงในรูปเดียว:
 #definegrid
g = sns. FacetGrid (data=df, col=' variable1 ', col_wrap= 2 )

#add plots to grid
g. map ( sns.scatterplot , ' variable2 ', ' variable3 ')
โปรดทราบว่าอาร์กิวเมนต์ col ระบุตัวแปรที่จะตัดและอาร์กิวเมนต์ col_wrap ระบุจำนวนแปลงที่จะแสดงต่อบรรทัด
ตัวอย่างต่อไปนี้แสดงวิธีใช้ฟังก์ชันนี้ในทางปฏิบัติกับชุดข้อมูล “เคล็ดลับ” ที่มีอยู่แล้วภายใน:
 #load tips dataset
tips = sns. load_dataset (' tips ')

#view first five rows of tips dataset
tips. head ()

   total_bill tip sex smoker day time size
0 16.99 1.01 Female No Sun Dinner 2
1 10.34 1.66 Male No Sun Dinner 3
2 21.01 3.50 Male No Sun Dinner 3
3 23.68 3.31 Male No Sun Dinner 2
4 24.59 3.61 Female No Sun Dinner 4
ตัวอย่างที่ 1: สร้างหลายเส้นทาง
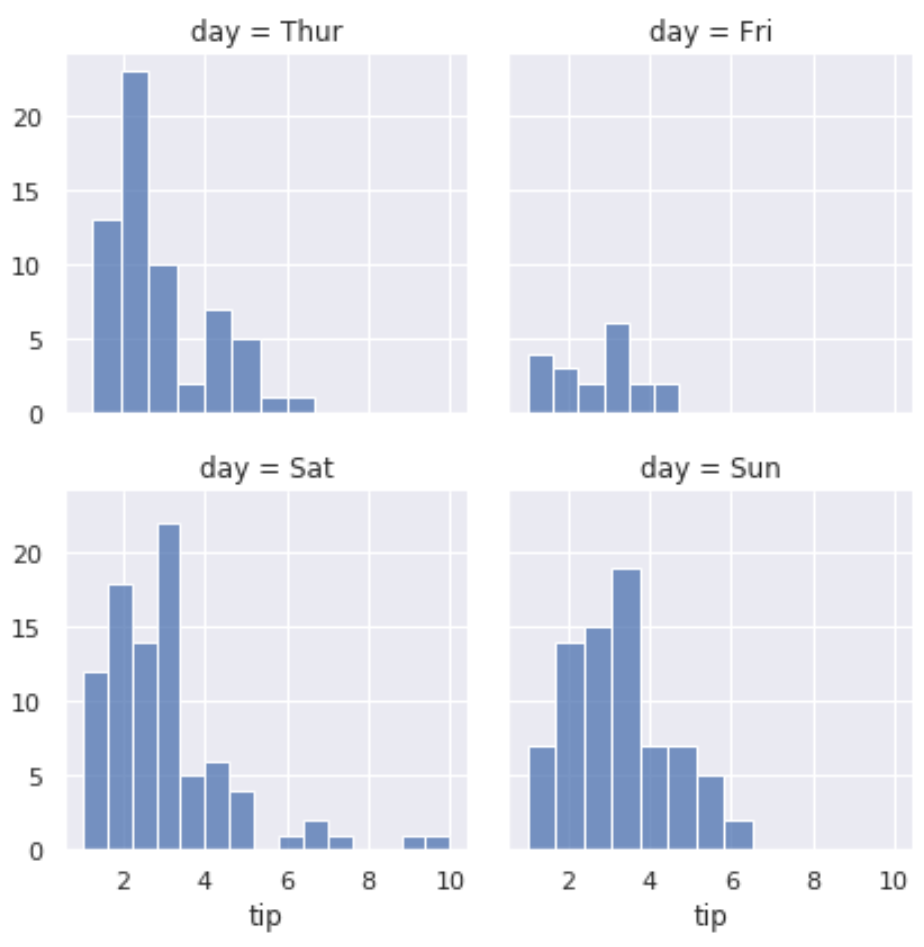
รหัสต่อไปนี้แสดงวิธีการสร้างแปลง Seaborn หลายแปลงในรูปเดียว:
 #define grid with two plots per row
g = sns. FacetGrid (data=tips, col=' day ', col_wrap= 2 )

#add histograms to each plot
g. map (sns. histplot , ' tip ')

นี่คือสิ่งที่เราทำกับโค้ดง่ายๆ นี้:
- ระบุให้จัดกลุ่มตามตัวแปร ‘วัน’
- กำหนดให้แสดง 2 แปลงต่อบรรทัด
- กำหนดให้แสดงฮิสโตแกรมในแต่ละแปลงที่แสดงการกระจายค่า “ทิป” ในแต่ละวัน
ตัวอย่างที่ 2: สร้างหลายเส้นทางที่มีความสูงเฉพาะ
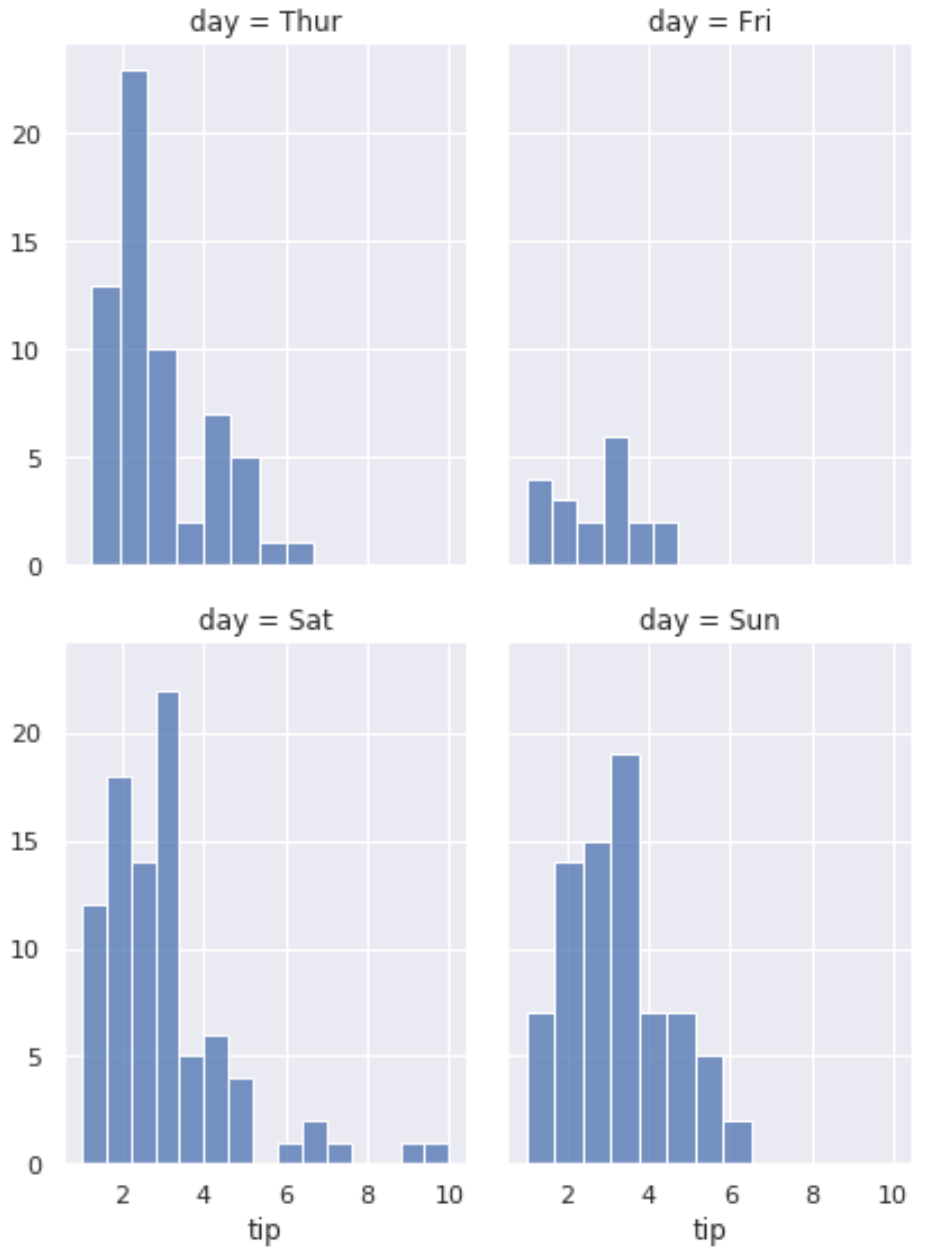
รหัสต่อไปนี้แสดงวิธีการสร้างแปลง Seaborn หลายแปลงที่มีความสูงและอัตราส่วนภาพเฉพาะ:
 #definegrid
g = sns. FacetGrid (data=tips, col=' day ', col_wrap= 2 , height= 4 , aspect= .75 )

#add histograms to each plot
g. map (sns. histplot , ' tip ')

ตัวอย่างที่ 3: สร้างหลายแปลงพร้อมคำอธิบายแผนภูมิ
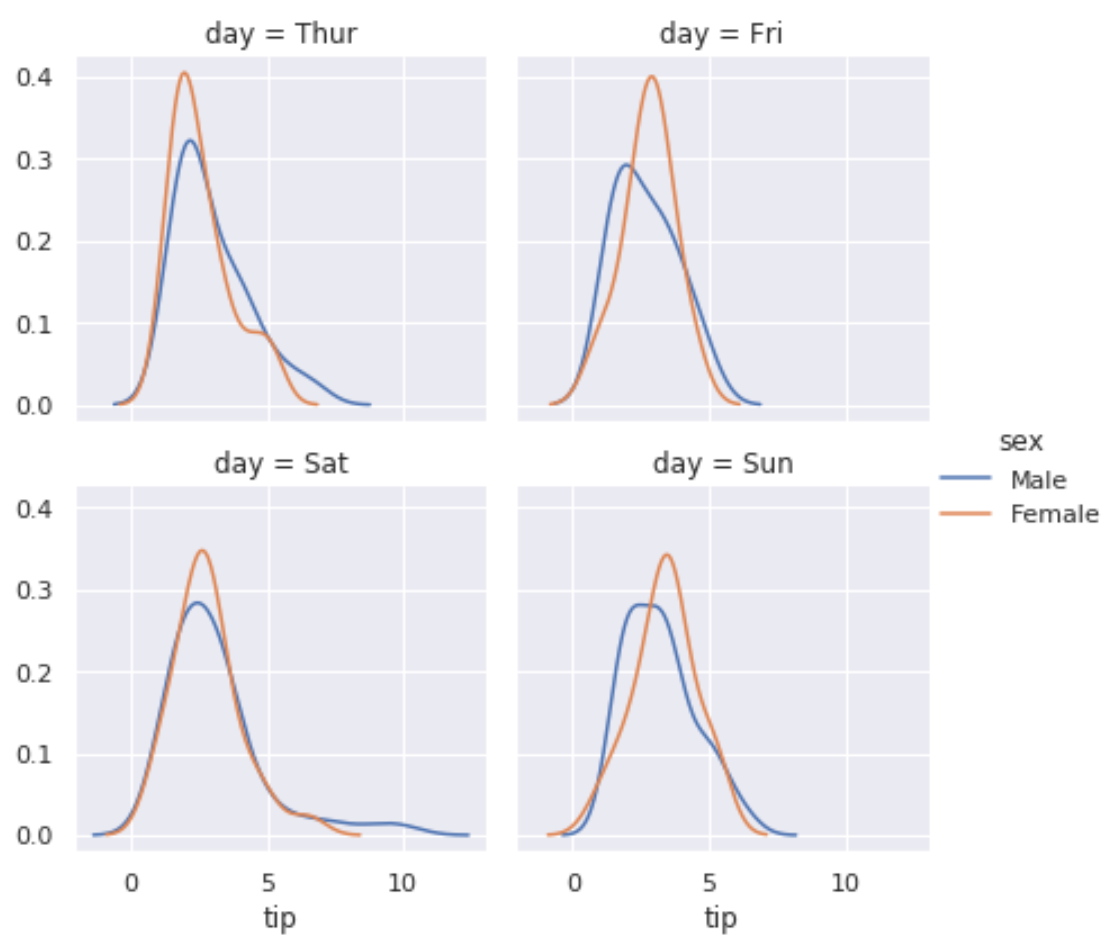
รหัสต่อไปนี้แสดงวิธีสร้างแปลง Seaborn หลายแปลงและเพิ่มคำอธิบาย:
 #definegrid
g = sns. FacetGrid (data=tips, col=' day ', hue=' sex ', col_wrap= 2 )

#add density plots to each plot
g. map ( sns.kdeplot , ' tip ')

#add legend
g. add_legend ()

แหล่งข้อมูลเพิ่มเติม
วิธีเพิ่มชื่อเรื่องให้กับแปลงทะเล
วิธีเปลี่ยนตำแหน่งของตำนานใน Seaborn
วิธีปรับขนาดฟิกเกอร์ของพล็อตเรื่อง Seaborn