Pandas: วิธีลงจุด dataframes หลายรายการในแผนย่อย
คุณสามารถใช้ไวยากรณ์พื้นฐานต่อไปนี้เพื่อลงจุด DataFrames แพนด้าหลายตัวในแผนย่อย:
 import matplotlib. pyplot as plt

#define subplot layout
fig, axes = plt. subplots (nrows= 2 , ncols= 2 )

#add DataFrames to subplots
df1. plot (ax=axes[0,0])
df2. plot (ax=axes[0,1])
df3. plot (ax=axes[1,0])
df4. plot (ax=axes[1,1])
ตัวอย่างต่อไปนี้แสดงวิธีใช้ไวยากรณ์นี้ในทางปฏิบัติ
ตัวอย่าง: การลงจุด DataFrames ของ Pandas หลายรายการในแผนย่อย
สมมติว่าเรามี DataFrames แพนด้าสี่ตัวที่มีข้อมูลเกี่ยวกับการขายและการคืนสินค้าในร้านค้าปลีกสี่แห่ง:
 import pandas as pd

#create four DataFrames
df1 = pd. DataFrame ({' sales ': [2, 5, 5, 7, 9, 13, 15, 17, 22, 24],
                    ' returns ': [1, 2, 3, 4, 5, 6, 7, 8, 7, 5]})

df2 = pd. DataFrame ({' sales ': [2, 5, 11, 18, 15, 15, 14, 9, 6, 7],
                    ' returns ': [1, 2, 0, 2, 2, 4, 5, 4, 2, 1]})

df3 = pd. DataFrame ({' sales ': [6, 8, 8, 7, 8, 9, 10, 7, 8, 12],
                    ' returns ': [1,0, 1, 1, 1, 2, 3, 2, 1, 3]})

df4 = pd. DataFrame ({' sales ': [10, 7, 7, 6, 7, 6, 4, 3, 3, 2],
                    ' returns ': [4, 4, 3, 3, 2, 3, 2, 1, 1, 0]})
เราสามารถใช้ไวยากรณ์ต่อไปนี้เพื่อลงจุดแต่ละ DataFrames เหล่านี้ในแผนย่อยที่มีเค้าโครง 2 แถวและ 2 คอลัมน์:
 import matplotlib. pyplot as plt

#define subplot layout
fig, axes = plt. subplots (nrows= 2 , ncols= 2 )

#add DataFrames to subplots
df1. plot (ax=axes[0,0])
df2. plot (ax=axes[0,1])
df3. plot (ax=axes[1,0])
df4. plot (ax=axes[1,1])

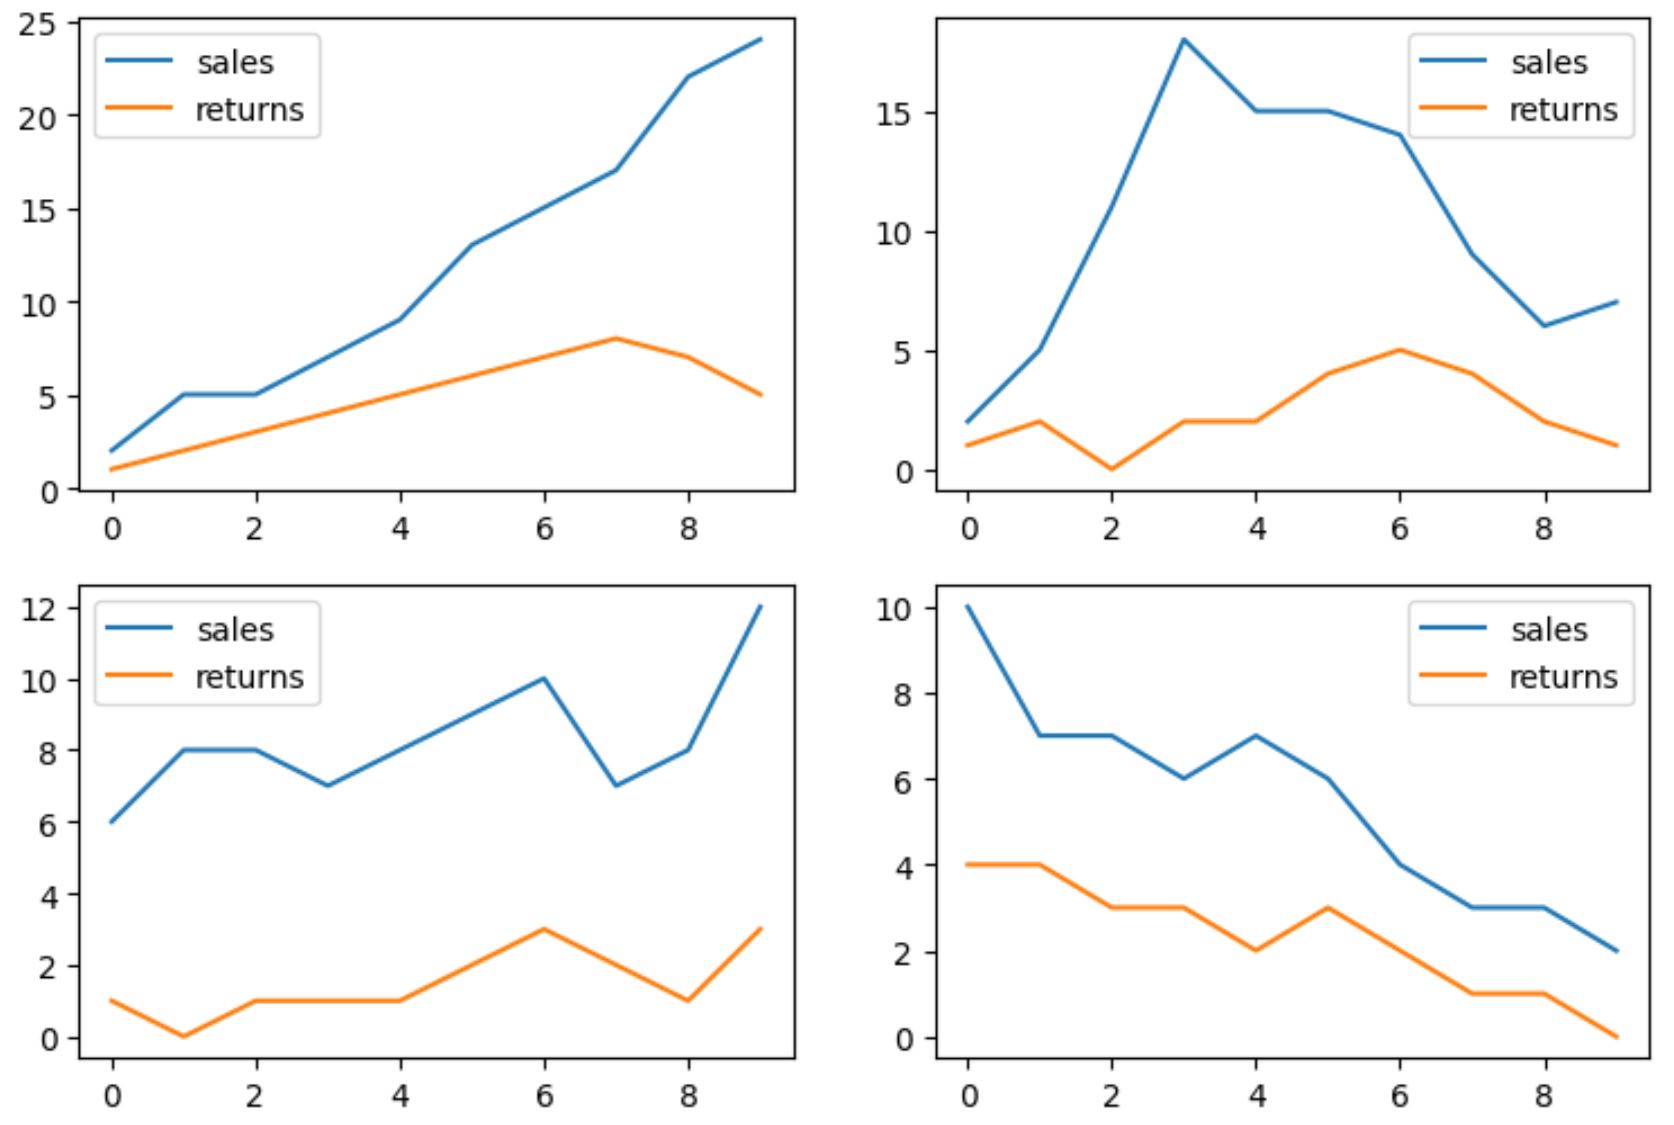
DataFrames ทั้งสี่แต่ละอันจะแสดงในแผนย่อย
โปรดทราบว่าเราใช้อาร์กิวเมนต์ axes เพื่อระบุตำแหน่งที่ควรวางแต่ละ DataFrame
ตัวอย่างเช่น DataFrame ชื่อ df1 ถูกวางในตำแหน่งที่มีค่าดัชนีแถวเป็น 0 และค่าดัชนีคอลัมน์เป็น 0 (เช่นแผนย่อยที่มุมซ้ายบน)
โปรดทราบว่าคุณสามารถเปลี่ยนเค้าโครงของแผนย่อยได้โดยใช้อาร์กิวเมนต์ nrows และ ncols
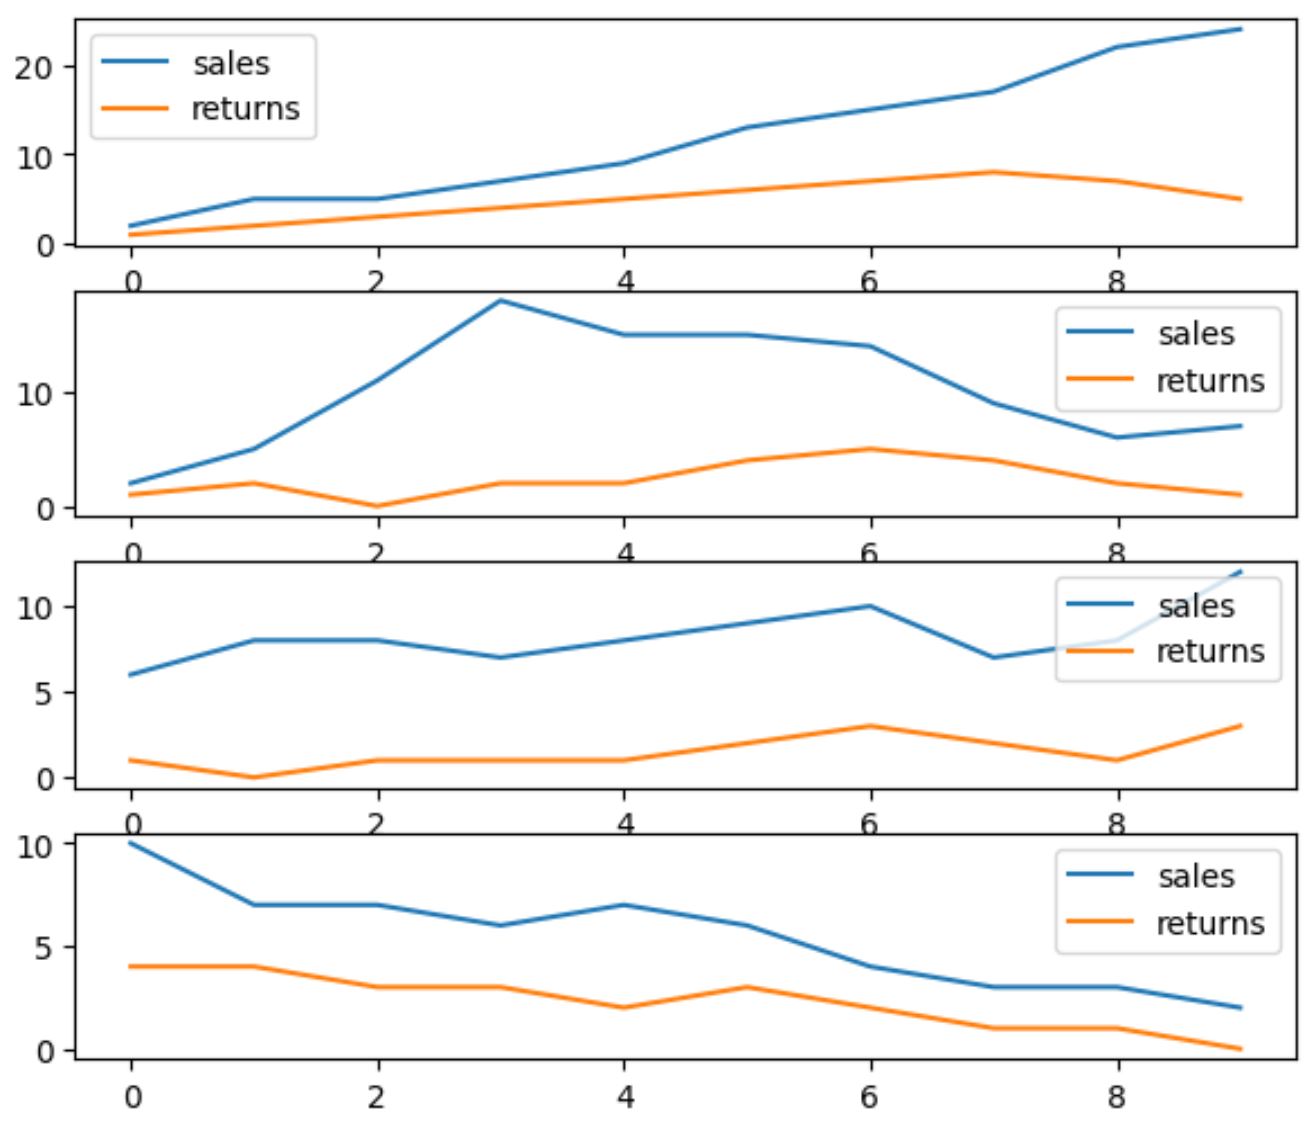
ตัวอย่างเช่น รหัสต่อไปนี้แสดงวิธีจัดระเบียบแผนย่อยเป็นสี่แถวและหนึ่งคอลัมน์:
 import matplotlib. pyplot as plt

#define subplot layout
fig, axes = plt. subplots (nrows= 4 , ncols= 1 )

#add DataFrames to subplots
df1. plot (ax=axes[0])
df2. plot (ax=axes[1])
df3. plot (ax=axes[2])
df4. plot (ax=axes[3])

ตอนนี้แผนย่อยได้รับการจัดเรียงในรูปแบบที่มีสี่แถวและหนึ่งคอลัมน์
โปรดทราบว่าหากคุณต้องการให้แผนย่อยมีสเกลเดียวกันบนแกน y และ x คุณสามารถใช้อาร์กิวเมนต์ sharey และ sharex ได้
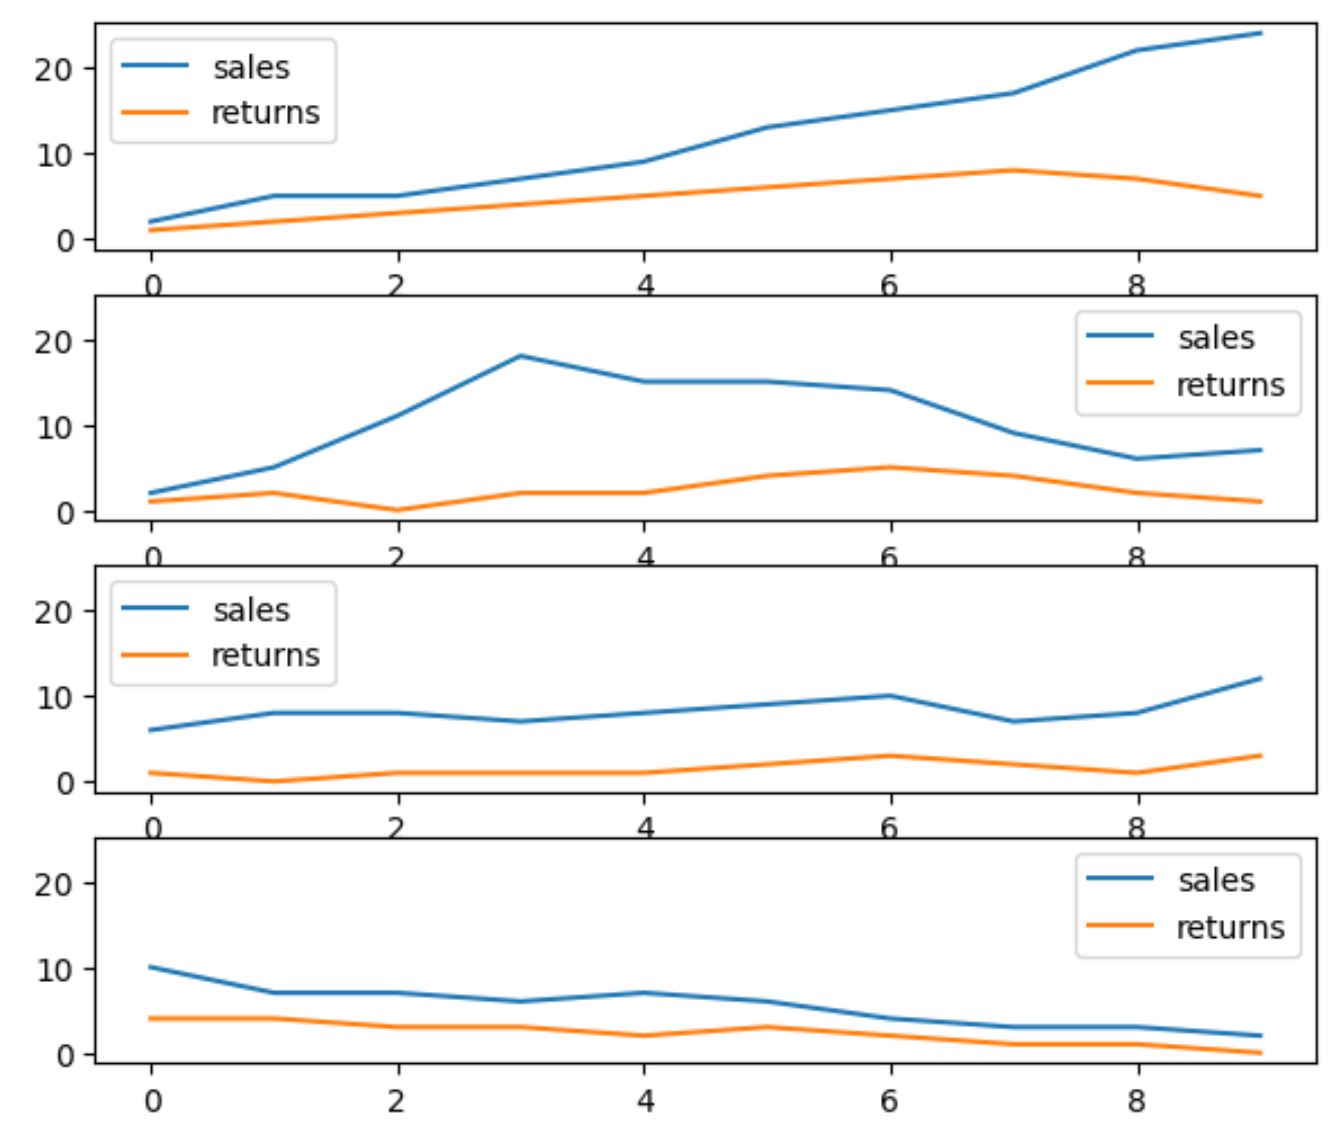
ตัวอย่างเช่น รหัสต่อไปนี้แสดงวิธีใช้อาร์กิวเมนต์ sharey เพื่อบังคับให้แผนย่อยทั้งหมดมีมาตราส่วนเดียวกันบนแกน Y:
 import matplotlib. pyplot as plt

#define subplot layout, force subplots to have same y-axis scale
fig, axes = plt. subplots (nrows= 4 , ncols= 1 , sharey= True )

#add DataFrames to subplots
df1. plot (ax=axes[0])
df2. plot (ax=axes[1])
df3. plot (ax=axes[2])
df4. plot (ax=axes[3])

โปรดทราบว่าแกน Y ของแต่ละแผนย่อยขณะนี้อยู่ในช่วงตั้งแต่ 0 ถึง 20
แหล่งข้อมูลเพิ่มเติม
บทช่วยสอนต่อไปนี้จะอธิบายวิธีดำเนินการทั่วไปอื่น ๆ ในแพนด้า:
วิธีสร้างแผนภูมิวงกลมจาก Pandas DataFrame
วิธีสร้างพอยต์คลาวด์จาก Pandas DataFrame
วิธีสร้างฮิสโตแกรมจาก Pandas DataFrame