วิธีสร้างแผนย่อยใน seaborn (พร้อมตัวอย่าง)
คุณสามารถใช้ไวยากรณ์พื้นฐานต่อไปนี้เพื่อสร้างแผนย่อยในไลบรารีการแสดงภาพข้อมูล Seaborn ใน Python:
 #define dimensions of subplots (rows, columns)
fig, axes = plt. subplots (2, 2)

#create chart in each subplot
sns. boxplot (data=df, x=' team ', y=' points ', ax=axes[0,0])
sns. boxplot (data=df, x=' team ', y=' assists ', ax=axes[0,1])

...
ตัวอย่างต่อไปนี้แสดงวิธีใช้ไวยากรณ์นี้ในทางปฏิบัติ
ตัวอย่าง: การสร้างแผนย่อยใน Seaborn
สมมติว่าเรามี DataFrame แพนด้าดังต่อไปนี้:
 import pandas as pd

#createDataFrame
df = pd. DataFrame ({' team ': ['A', 'A', 'A', 'A', 'B', 'B', 'B', 'B'],
                   ' points ': [19, 12, 15, 14, 19, 23, 25, 29],
                   ' assists ': [13, 15, 11, 8, 6, 8, 11, 14],
                   ' rebounds ': [11, 7, 8, 12, 13, 7, 6, 8],
                   ' blocks ': [1, 2, 2, 3, 5, 4, 3, 3]})

#view DataFrame
print (df)

  team points assists rebounds blocks
0 A 19 13 11 1
1 A 12 15 7 2
2 A 15 11 8 2
3 A 14 8 12 3
4 B 19 6 13 5
5 B 23 8 7 4
6 B 25 11 6 3
7 B 29 14 8 3
รหัสต่อไปนี้แสดงวิธีการกำหนดพื้นที่การลงจุดด้วยสองแถวและสองคอลัมน์ และสร้าง boxplot ในแต่ละแผนย่อยสำหรับตัวแปรตัวเลขทั้งสี่ตัวใน DataFrame:
 import matplotlib. pyplot as plt
import seaborn as sns

#set seaborn plotting aesthetics as default
sns. set ()

#define plotting region (2 rows, 2 columns)
fig, axes = plt. subplots (2, 2)

#create boxplot in each subplot
sns. boxplot (data=df, x=' team ', y=' points ', ax=axes[0,0])
sns. boxplot (data=df, x=' team ', y=' assists ', ax=axes[0,1])
sns. boxplot (data=df, x=' team ', y=' rebounds ', ax=axes[1,0])
sns. boxplot (data=df, x=' team ', y=' blocks ', ax=axes[1,1])
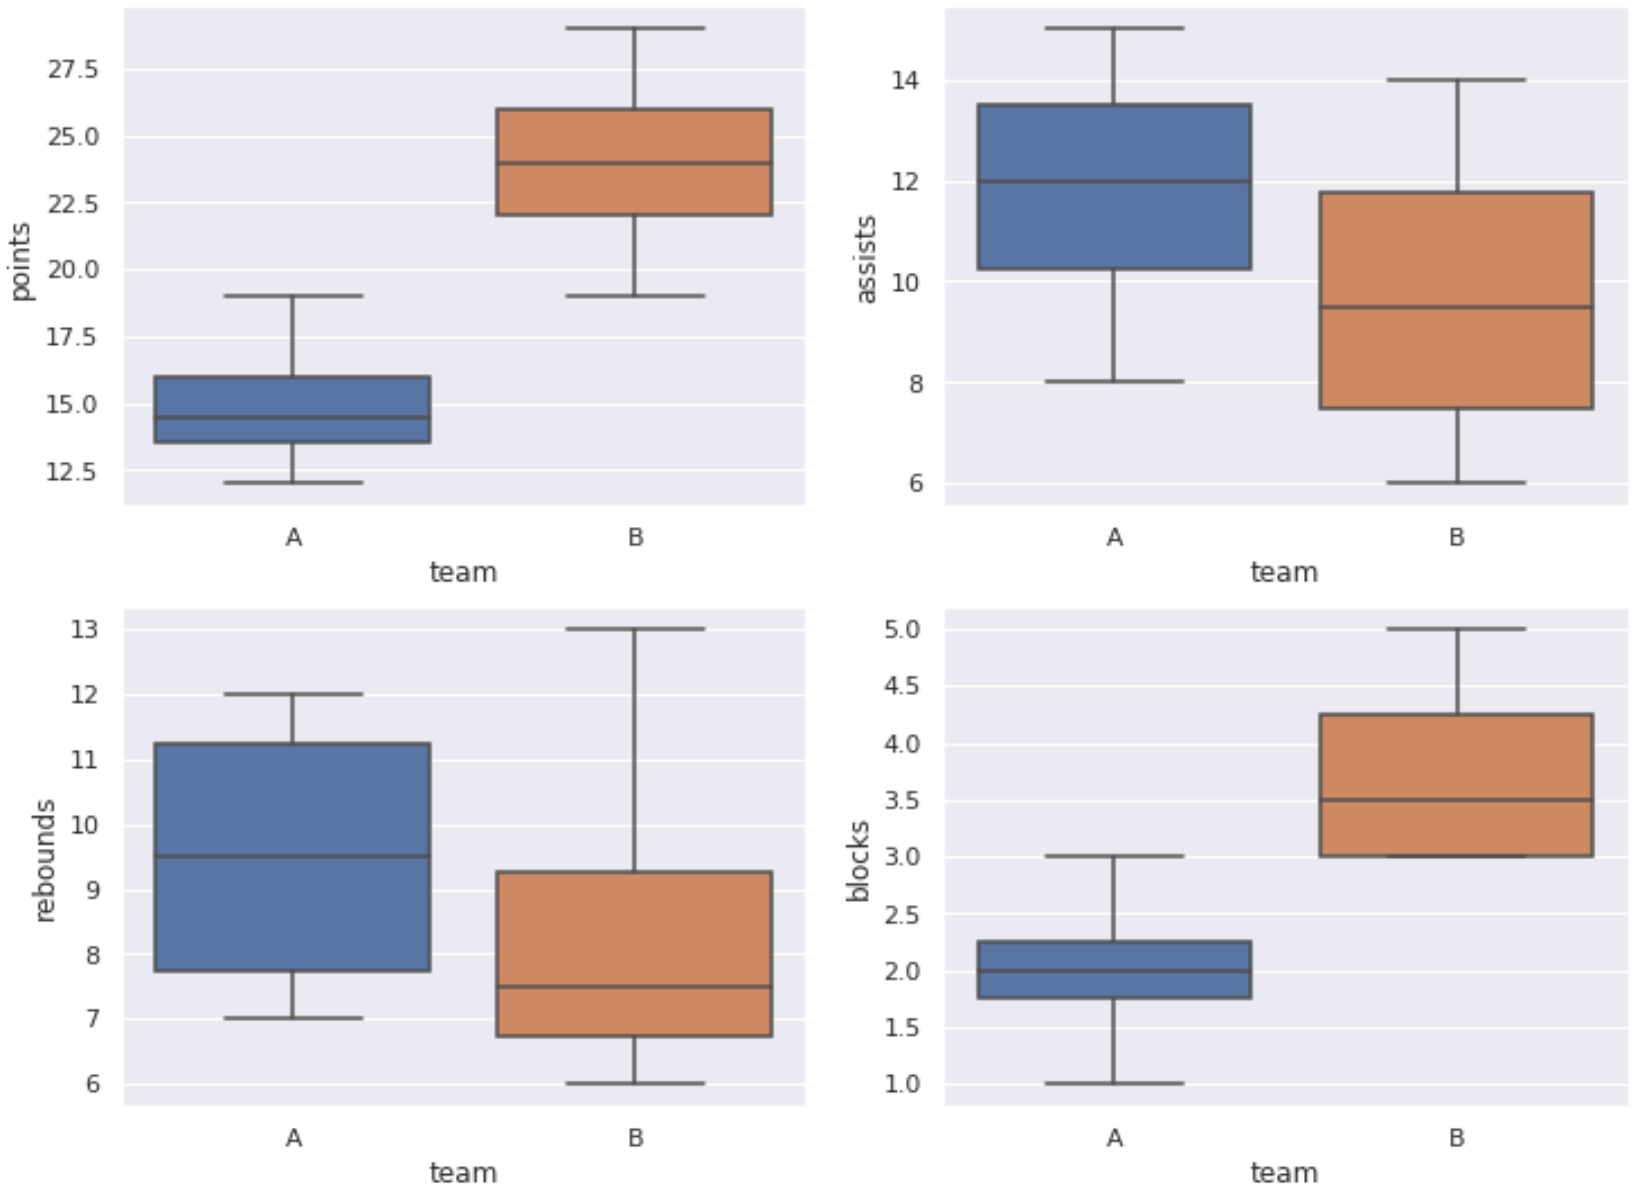
ในตัวอย่างนี้ เราสร้างพื้นที่การลงจุดด้วยสองแถวและสองคอลัมน์ และเติมแต่ละแผนย่อยด้วย boxplots
อย่างไรก็ตาม เราสามารถใช้ไวยากรณ์ที่คล้ายกันเพื่อสร้างพื้นที่การลงจุดที่มีมิติต่างกัน และเติมข้อมูลในแผนย่อยด้วยกราฟที่ต่างกัน
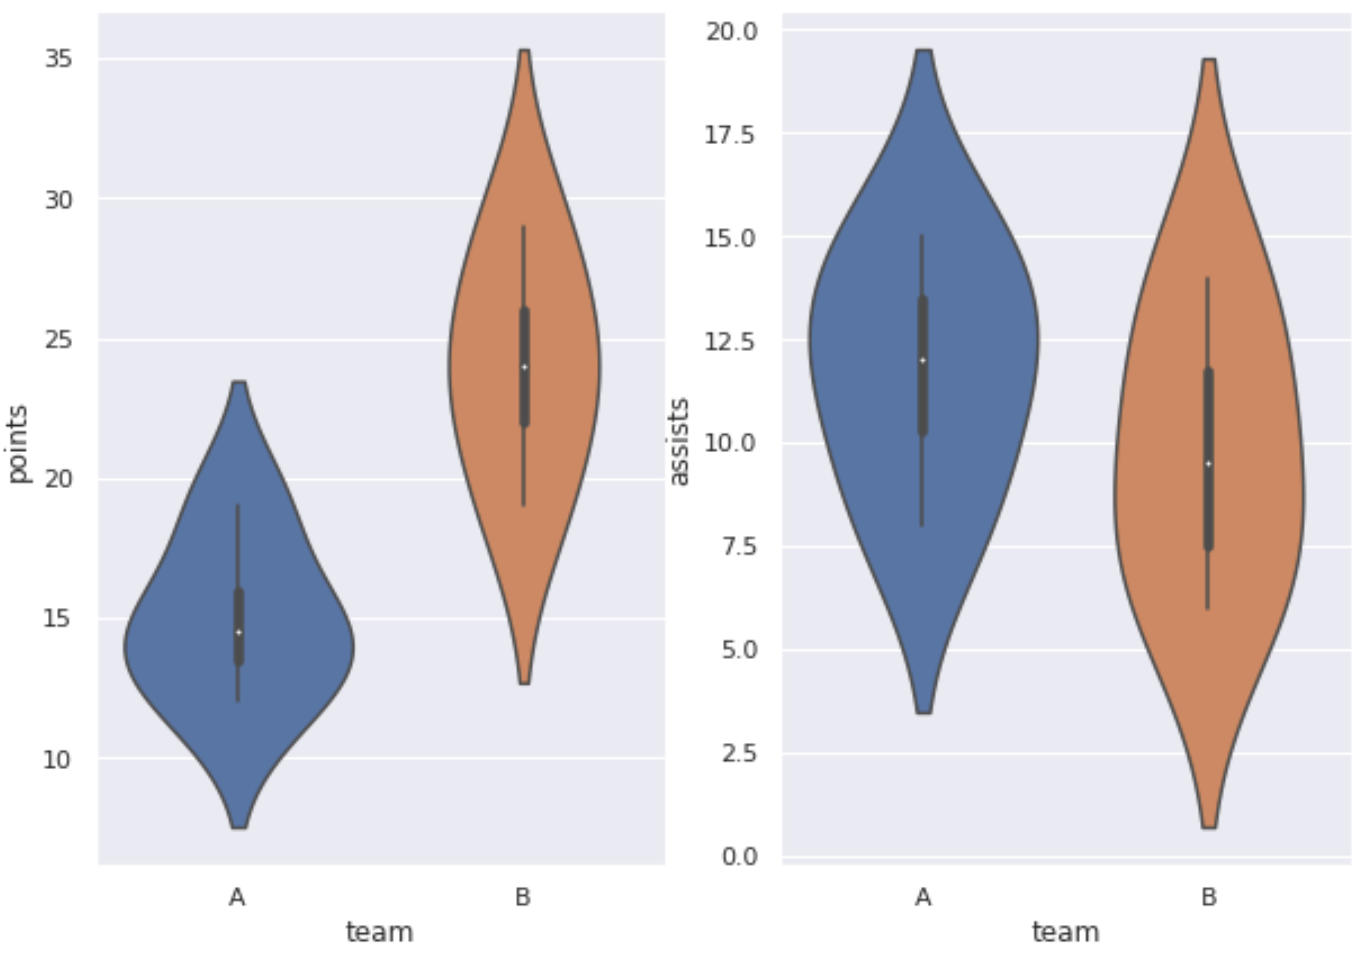
ตัวอย่างเช่น รหัสต่อไปนี้แสดงวิธีสร้างขอบเขตการลงจุดด้วยหนึ่งแถวและสองคอลัมน์ และเติมแต่ละจุดด้วยพล็อตไวโอลิน:
 import matplotlib. pyplot as plt
import seaborn as sns

#set seaborn plotting aesthetics as default
sns. set ()

#define plotting region (1 row, 2 columns)
fig, axes = plt. subplots (1, 2)

#create boxplot in each subplot
sns. violinplot (data=df, x=' team ', y=' points ', ax=axes[0])
sns. violinplot (data=df, x=' team ', y=' assists ', ax=axes[1])
แหล่งข้อมูลเพิ่มเติม
บทช่วยสอนต่อไปนี้จะอธิบายวิธีการทำหน้าที่ทั่วไปอื่นๆ ในทะเล:
วิธีเพิ่มชื่อเรื่องให้กับแปลงทะเล
วิธีบันทึกพล็อต Seaborn ลงในไฟล์
วิธีเปลี่ยนตำแหน่งของตำนานใน Seaborn
เกี่ยวกับผู้แต่ง
ดร.เบนจามิน แอนเดอร์สัน
สวัสดี ฉันชื่อเบนจามิน ศาสตราจารย์สถิติเกษียณอายุแล้ว และผันตัวมาเป็นครูสอนสถิติโดยเฉพาะ ด้วยประสบการณ์และความเชี่ยวชาญที่กว้างขวางในสาขาสถิติ ฉันกระตือรือร้นที่จะแบ่งปันความรู้ของฉันเพื่อเสริมศักยภาพนักเรียนผ่าน Statorials. รู้เพิ่มเติม