วิธีสร้าง boxplot จาก pandas dataframe
คุณสามารถใช้ไวยากรณ์ต่อไปนี้เพื่อสร้าง boxplots จาก Pandas DataFrame:
 #create boxplot of one column
df. boxplot (column=[' col1 '])

#create boxplot of multiple columns
df. boxplot (column=[' col1 ', ' col2 '])

#create boxplot grouped by one column
df. boxplot (column=[' col1 '], by=' col2 ')
ตัวอย่างต่อไปนี้แสดงวิธีการใช้ไวยากรณ์นี้ในทางปฏิบัติกับ DataFrame ต่อไปนี้:
 import pandas as pd

#createDataFrame
df = pd. DataFrame ({' conference ': ['A', 'A', 'A', 'B', 'B', 'B'],
                   ' points ': [5, 7, 7, 9, 12, 9],
                   ' assists ': [11, 8, 10, 6, 6, 5],
                   ' rebounds ': [4, 2, 5, 8, 6, 11],})

#view DataFrame
df
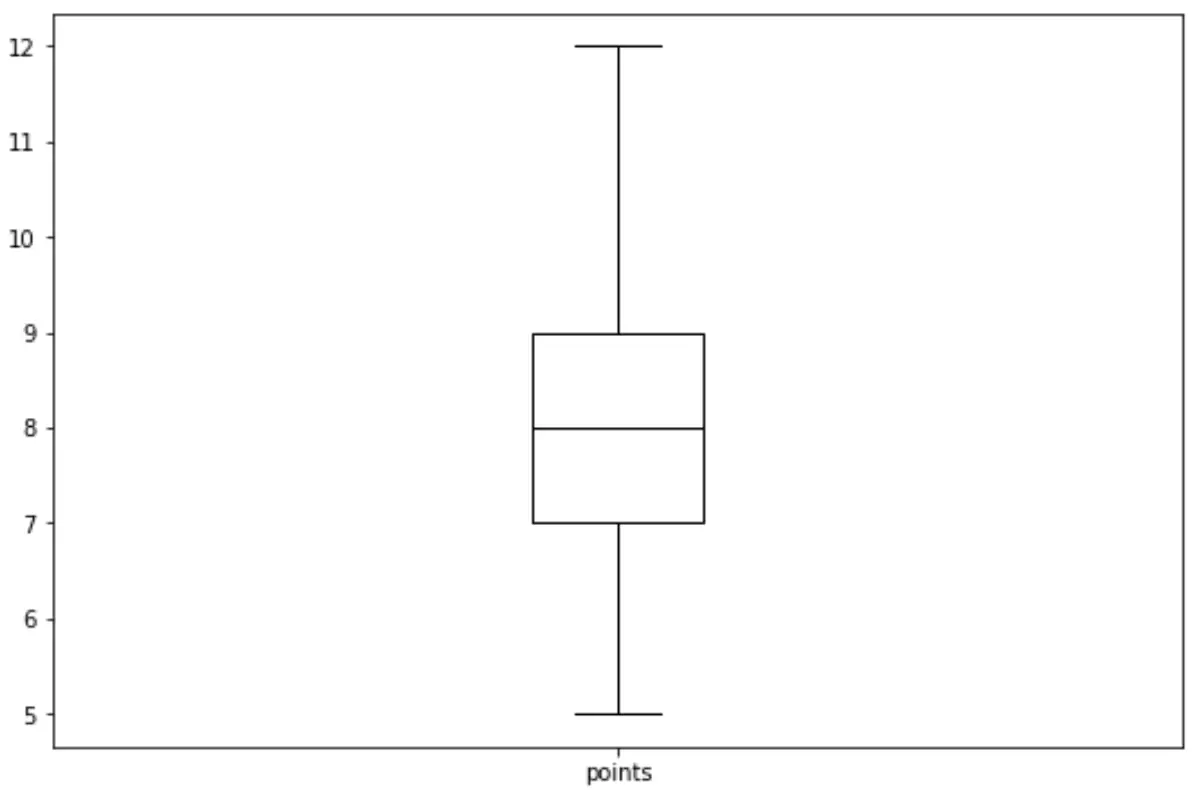
ตัวอย่างที่ 1: Boxplot ของคอลัมน์
รหัสต่อไปนี้แสดงวิธีการสร้าง boxplot สำหรับคอลัมน์ใน Pandas DataFrame:
df. boxplot (column=[' points '], grid= False , color=' black ')
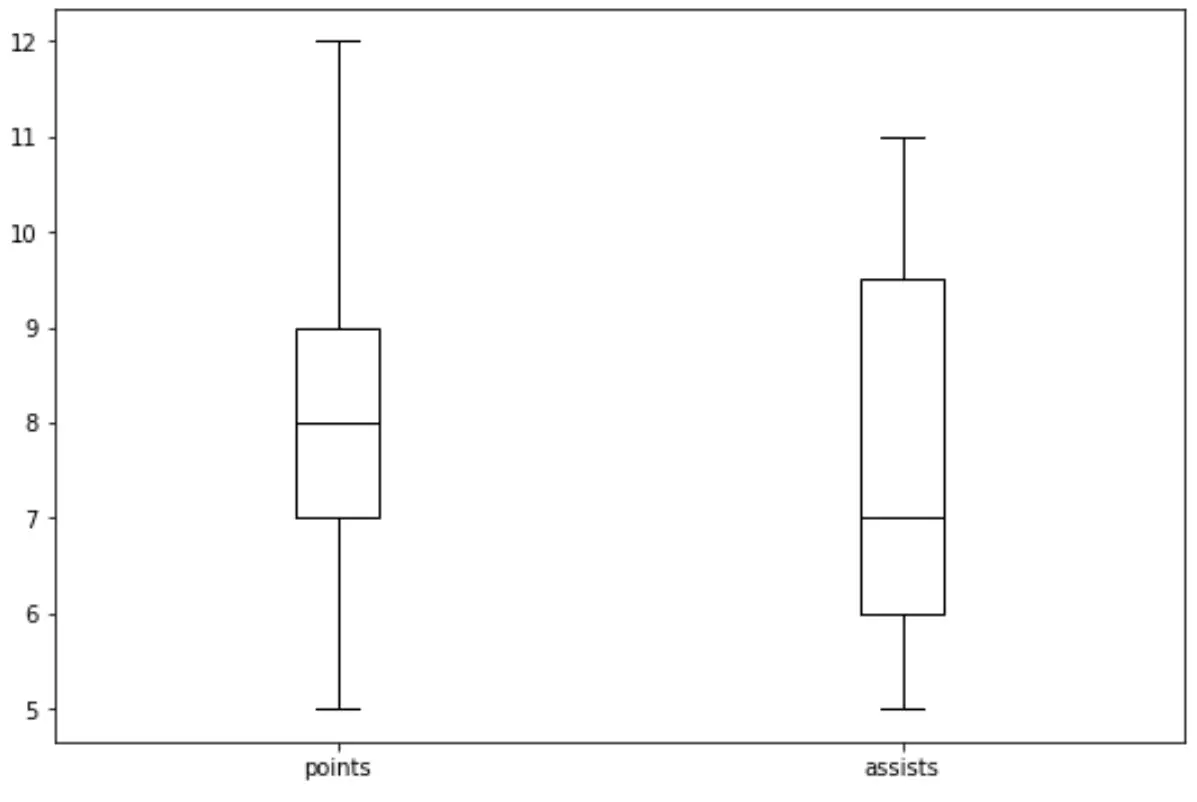
ตัวอย่างที่ 2: Boxplot ของหลายคอลัมน์
รหัสต่อไปนี้แสดงวิธีการสร้าง boxplot สำหรับหลายคอลัมน์ใน Pandas DataFrame:
df. boxplot (column=[' points ', ' assists '], grid= False , color=' black ')
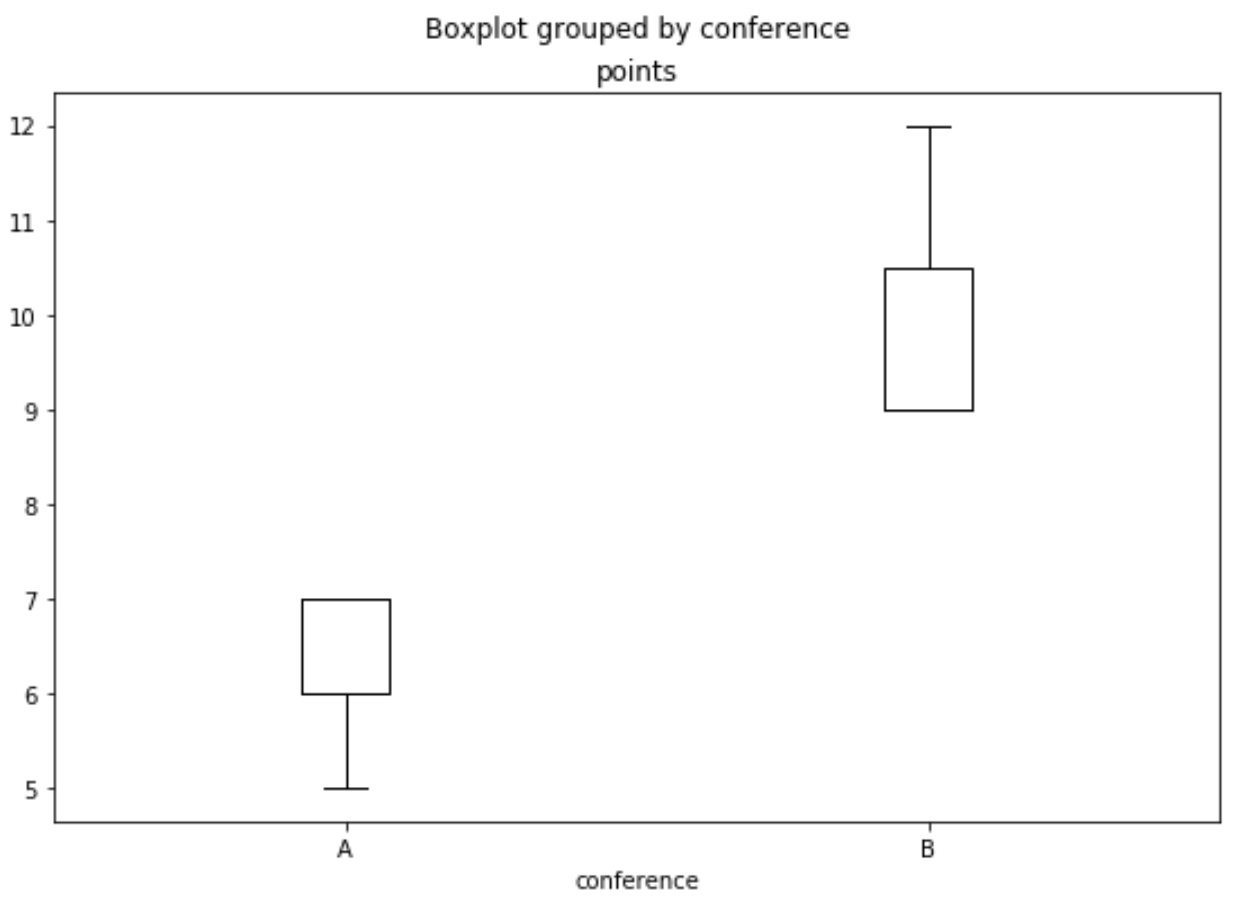
ตัวอย่างที่ 3: Boxplot จัดกลุ่มตามคอลัมน์เดียว
รหัสต่อไปนี้แสดงวิธีการสร้าง boxplot จัดกลุ่มตามคอลัมน์ใน DataFrame แพนด้า:
df. boxplot (column=[' points '], by=' conference ', grid= False , color=' black ')
แหล่งข้อมูลเพิ่มเติม
Pandas: วิธีพล็อตซีรีย์หลาย ๆ เรื่อง
Pandas: วิธีลงจุดหลายคอลัมน์บนแผนภูมิแท่ง
เกี่ยวกับผู้แต่ง
ดร.เบนจามิน แอนเดอร์สัน
สวัสดี ฉันชื่อเบนจามิน ศาสตราจารย์สถิติเกษียณอายุแล้ว และผันตัวมาเป็นครูสอนสถิติโดยเฉพาะ ด้วยประสบการณ์และความเชี่ยวชาญที่กว้างขวางในสาขาสถิติ ฉันกระตือรือร้นที่จะแบ่งปันความรู้ของฉันเพื่อเสริมศักยภาพนักเรียนผ่าน Statorials. รู้เพิ่มเติม