Matplotlib'de alt grafik boyutu nasıl ayarlanır
Matplotlib’deki alt grafiklerin boyutunu ayarlamak için aşağıdaki sözdizimini kullanabilirsiniz:
 #specify one size for all subplots
fig, ax = plt. subplots (2, 2, figsize=(10,7))

#specify individual sizes for subplots
fig, ax = plt. subplots (1, 2, gridspec_kw={' width_ratios ': [3, 1]})
Aşağıdaki örnekler bu sözdiziminin pratikte nasıl kullanılacağını göstermektedir.
Örnek 1: Tüm alt noktalar için bir boyut belirtin
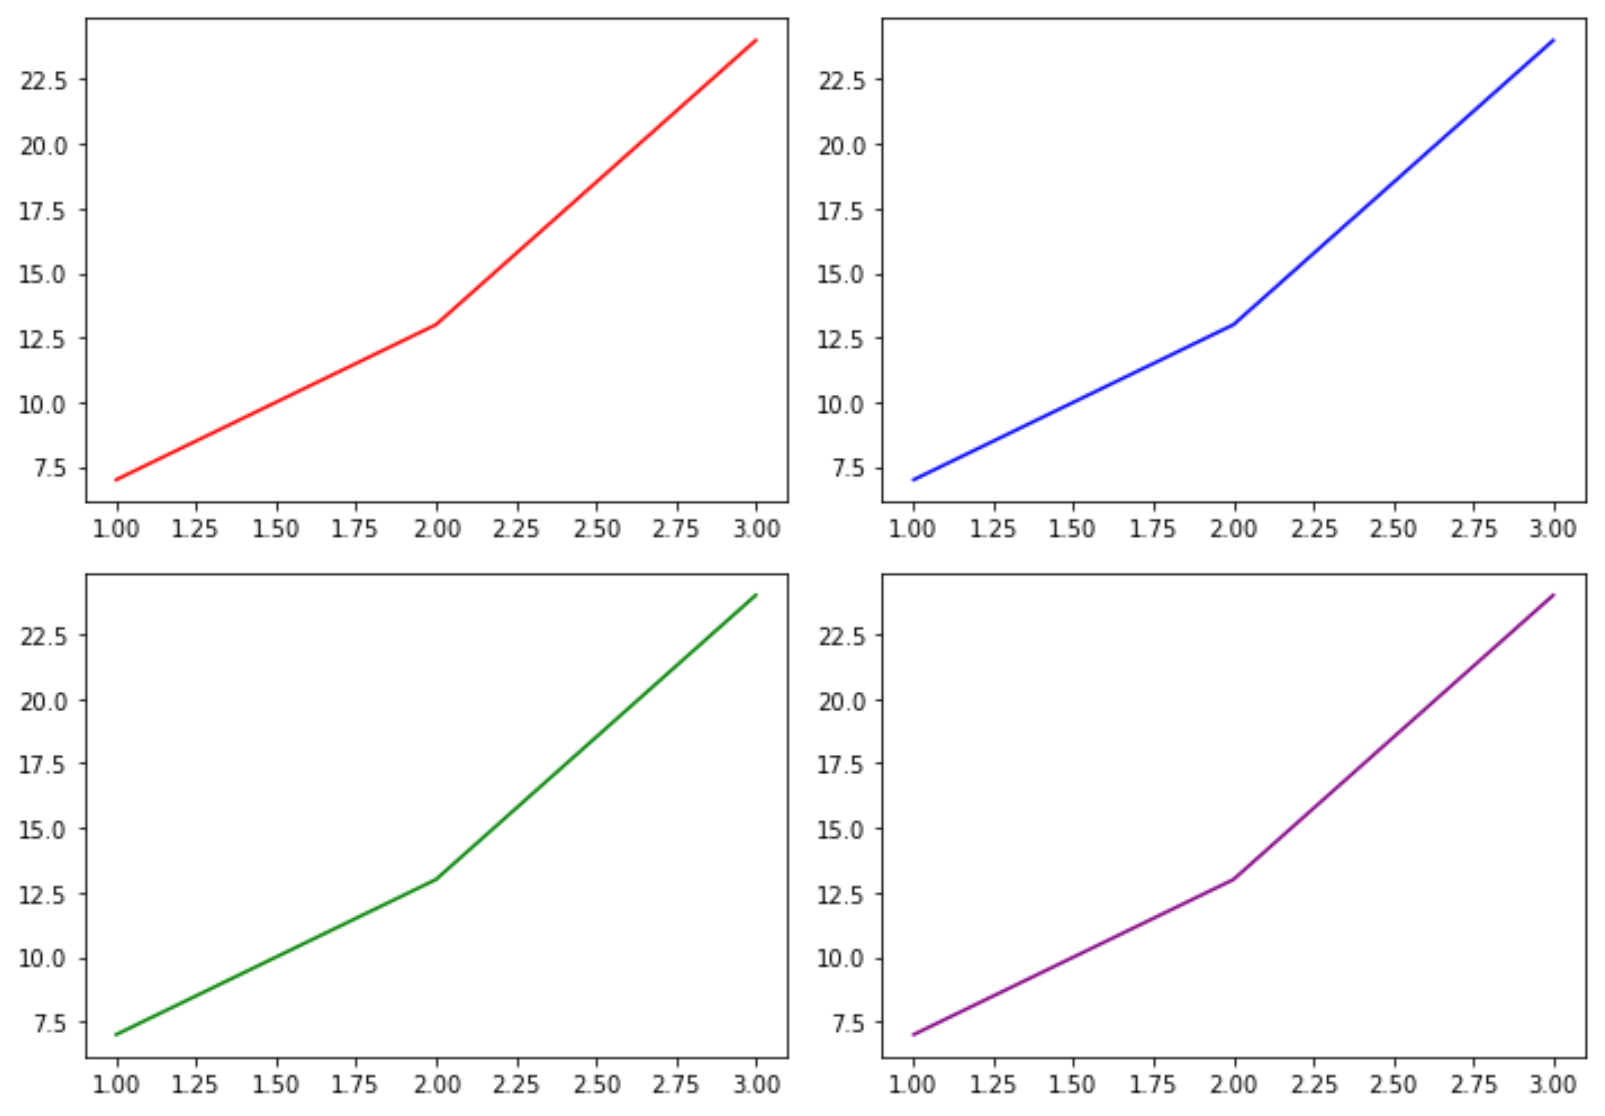
Aşağıdaki kod, tüm alt noktalar için boyutun nasıl belirleneceğini gösterir:
 import matplotlib. pyplot as plt

#define subplots
fig, ax = plt. subplots (2, 2, figsize=(10,7))
fig. tight_layout ()

#define data
x = [1, 2, 3]
y = [7, 13, 24]

#create subplots
ax[0, 0]. plot (x,y,color=' red ')
ax[0, 1]. plot (x,y,color=' blue ')
ax[1, 0]. plot (x,y,color=' green ')
ax[1, 1]. plot (x,y,color=' purple ')

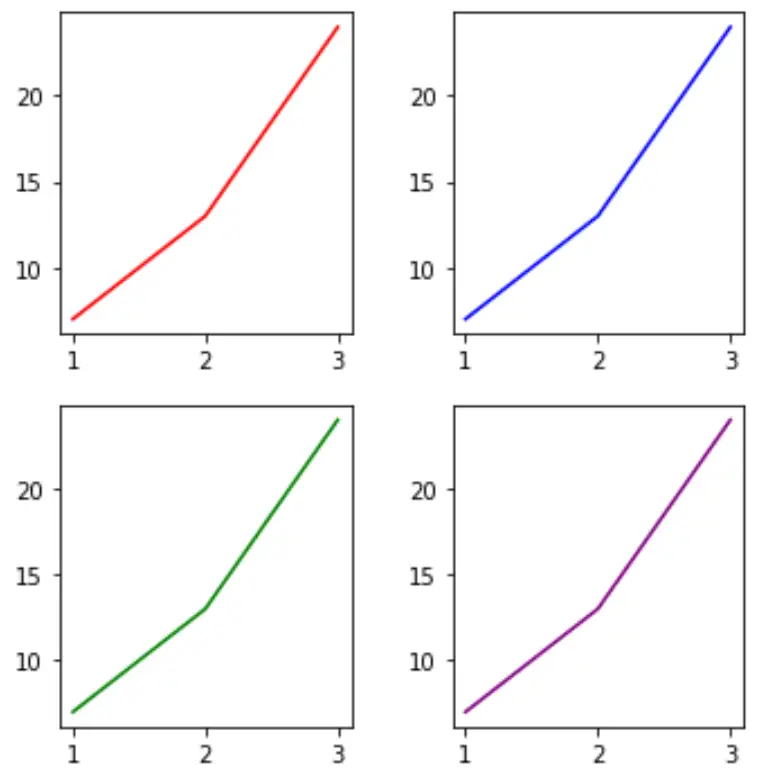
İncir boyutu argümanının değerlerini değiştirerek çıkarmaların boyutunu kolayca değiştirebiliriz:
 import matplotlib. pyplot as plt

#define subplots
fig, ax = plt. subplots (2, 2, figsize=(5,5))
fig. tight_layout ()

#define data
x = [1, 2, 3]
y = [7, 13, 24]

#create subplots
ax[0, 0]. plot (x,y,color=' red ')
ax[0, 1]. plot (x,y,color=' blue ')
ax[1, 0]. plot (x,y,color=' green ')
ax[1, 1]. plot (x,y,color=' purple ')

Örnek 2: Bireysel alt grafiklerin boyutlarını belirtin
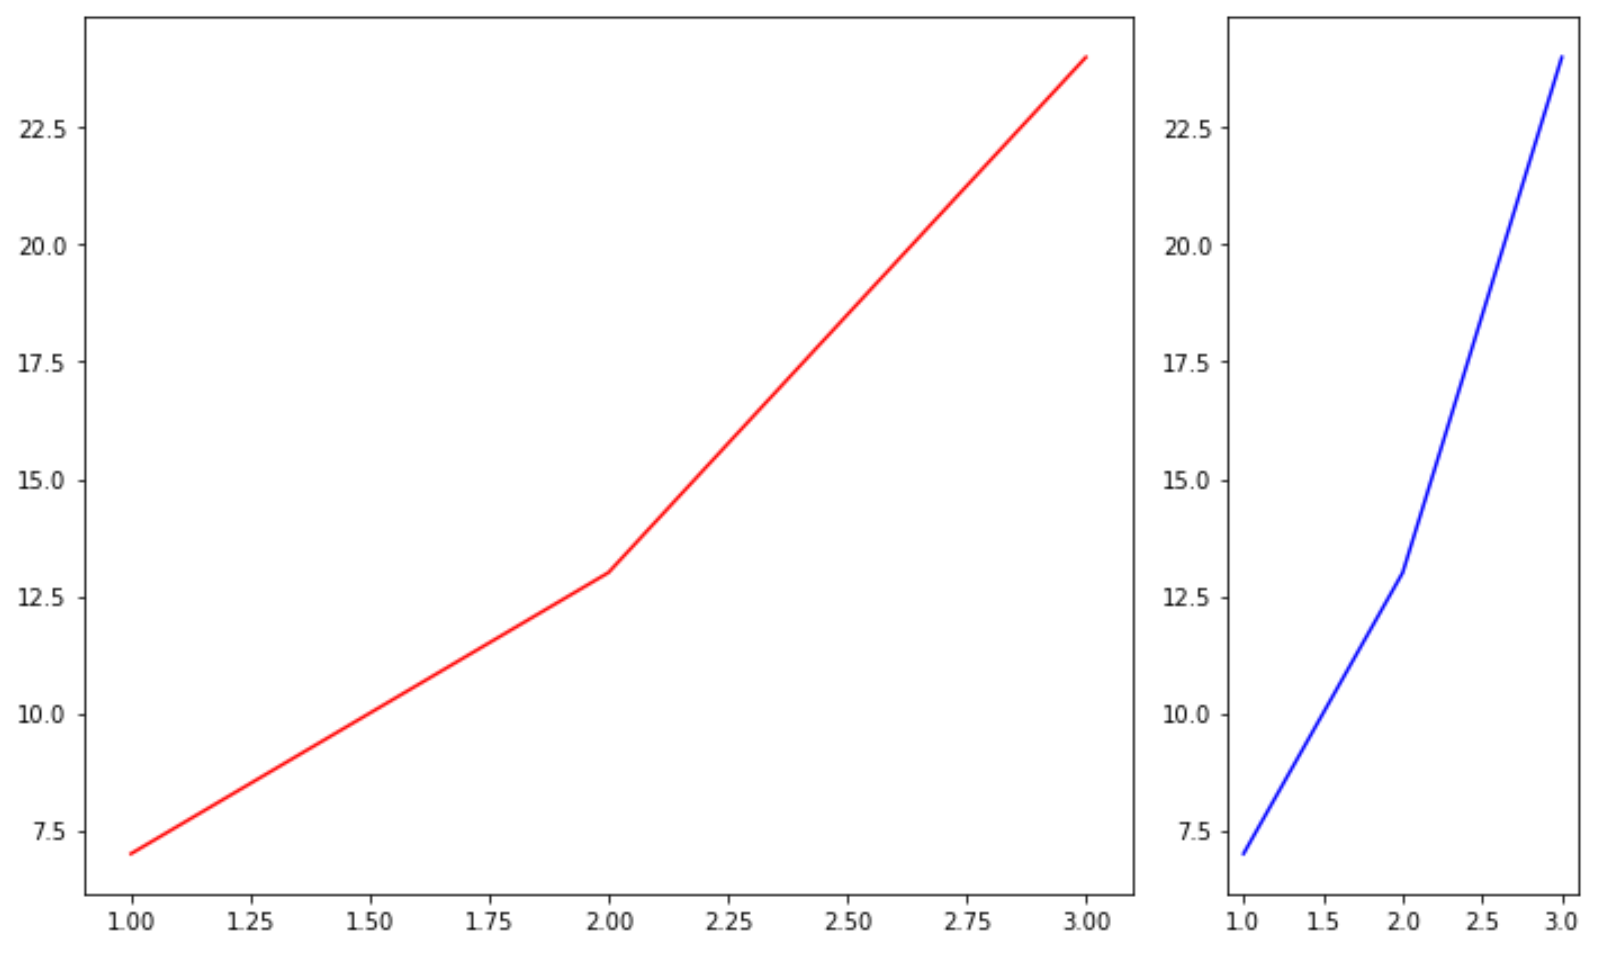
Aşağıdaki kod, bireysel alt noktalar için farklı boyutların nasıl belirtileceğini gösterir:
 import matplotlib. pyplot as plt

#define subplots
fig, ax = plt. subplots (1, 2, gridspec_kw={' width_ratios ': [3, 1]})
fig. tight_layout ()

#define data
x = [1, 2, 3]
y = [7, 13, 24]

#create subplots
ax[0]. plot (x,y,color=' red ')
ax[1]. plot (x,y,color=' blue ')

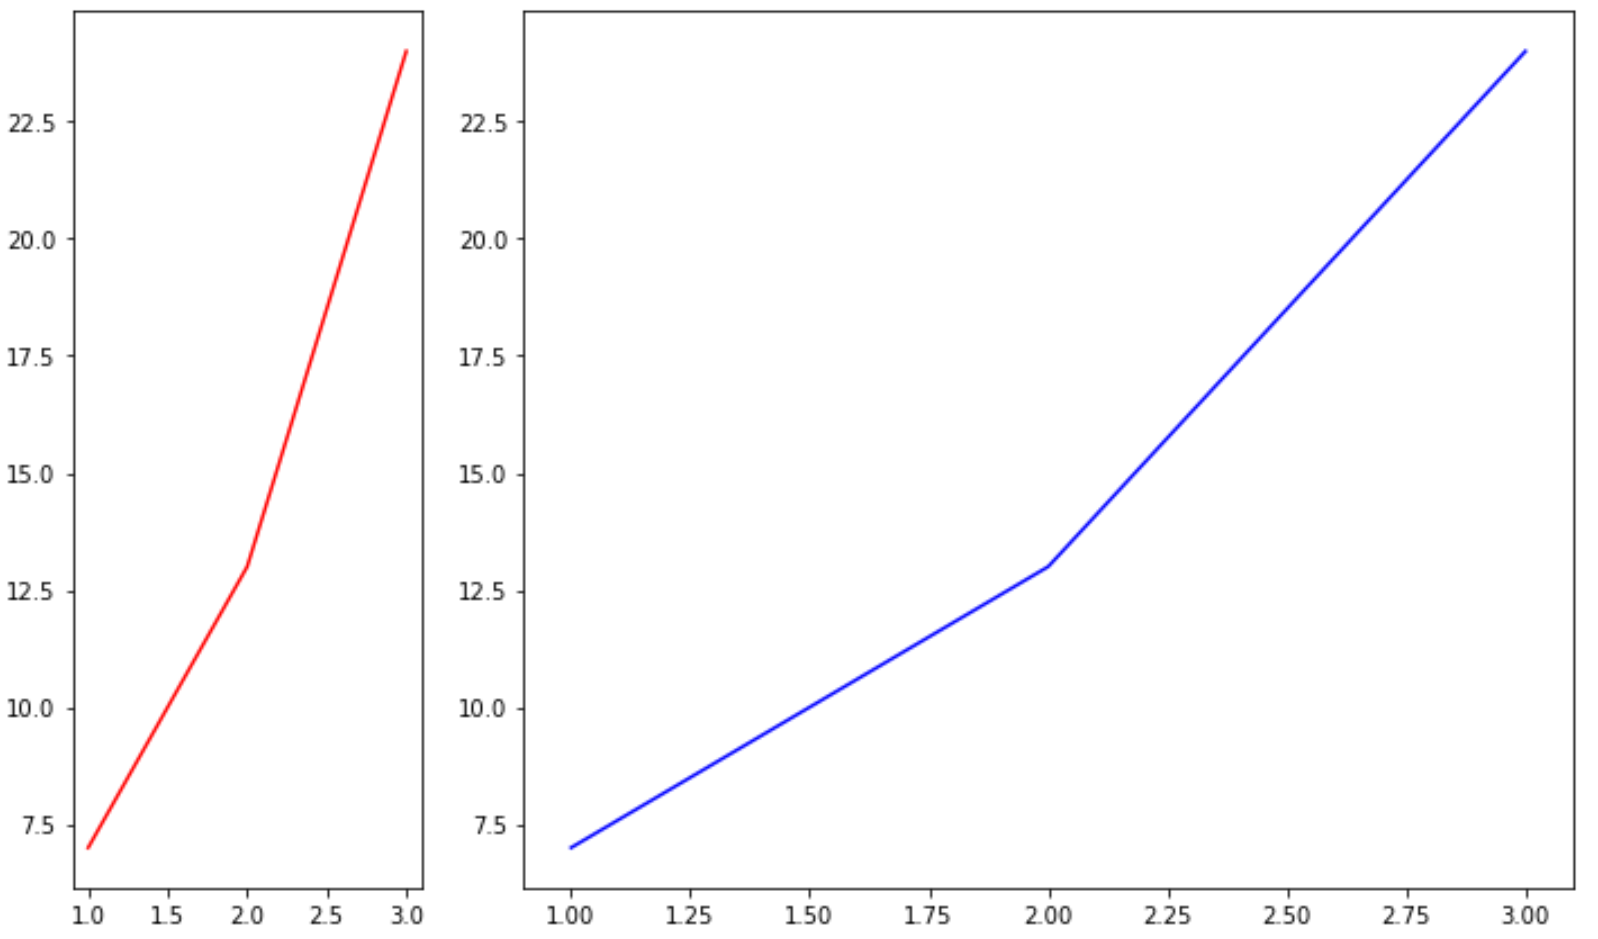
width_ratio argümanındaki değerleri değiştirerek çıkarmaların boyutunu kolayca değiştirebiliriz:
 import matplotlib. pyplot as plt

#define subplots
fig, ax = plt. subplots (1, 2, gridspec_kw={' width_ratios ': [1, 3]})
fig. tight_layout ()

#define data
x = [1, 2, 3]
y = [7, 13, 24]

#create subplots
ax[0]. plot (x,y,color=' red ')
ax[1]. plot (x,y,color=' blue ')

Ek kaynaklar
Matplotlib’deki grafiklere başlıklar nasıl eklenir?
Matplotlib’de eksen aralıkları nasıl ayarlanır
Matplotlib’de X ekseni değerleri nasıl ayarlanır?