Python'da çan eğrisi nasıl oluşturulur
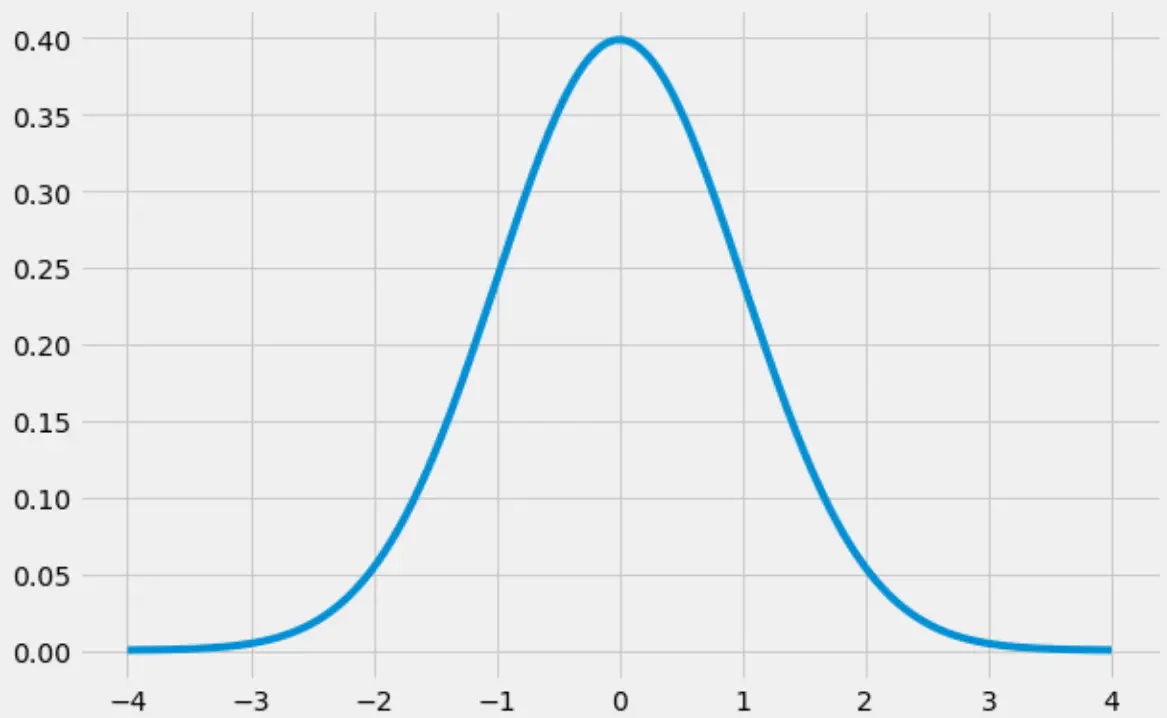
“Çan eğrisi” , farklı bir “çan” şekline sahip olan normal dağılım şekline verilen takma addır :

Bu eğitimde Python’da çan eğrisinin nasıl oluşturulacağı açıklanmaktadır.
Python’da Çan Eğrisi Nasıl Oluşturulur
Aşağıdaki kod, numpy , scipy ve matplotlib kitaplıklarını kullanarak çan eğrisinin nasıl oluşturulacağını gösterir:
 import numpy as np
import matplotlib.pyplot as plt
from scipy.stats import norm

#create range of x-values from -4 to 4 in increments of .001
x = np.arange(-4, 4, 0.001)

#create range of y-values that correspond to normal pdf with mean=0 and sd=1
y = norm.pdf(x,0,1)

#defineplot
fig, ax = plt.subplots(figsize=(9,6))
ax.plot(x,y)

#choose plot style and display the bell curve
plt.style.use('fivethirtyeight')
plt.show()

Python’da Çan Eğrisi Nasıl Doldurulur
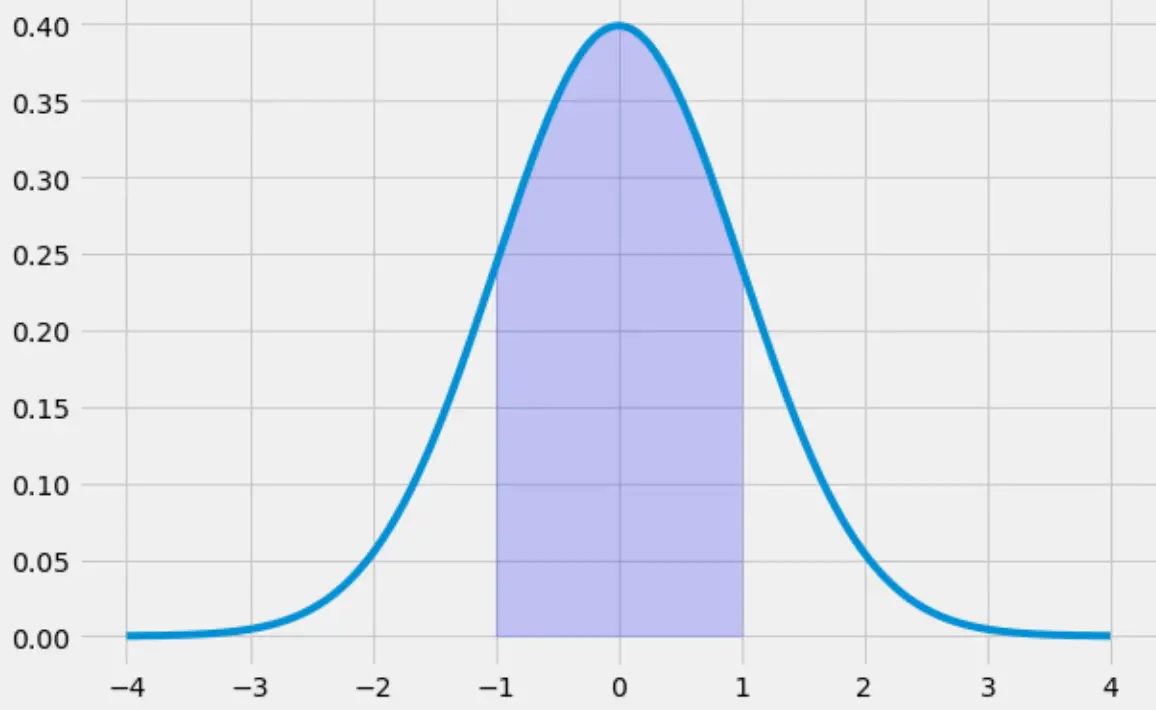
Aşağıdaki kod -1’den 1’e giden çan eğrisinin altındaki alanın nasıl doldurulacağını gösterir:
 x = np.arange(-4, 4, 0.001)
y = norm.pdf(x,0,1)

fig, ax = plt.subplots(figsize=(9,6))
ax.plot(x,y)

#specify the region of the bell curve to fill in
x_fill = np.arange(-1, 1, 0.001)
y_fill = norm.pdf(x_fill,0,1)
ax.fill_between(x_fill,y_fill,0, alpha=0.2, color='blue')

plt.style.use('fivethirtyeight')
plt.show()

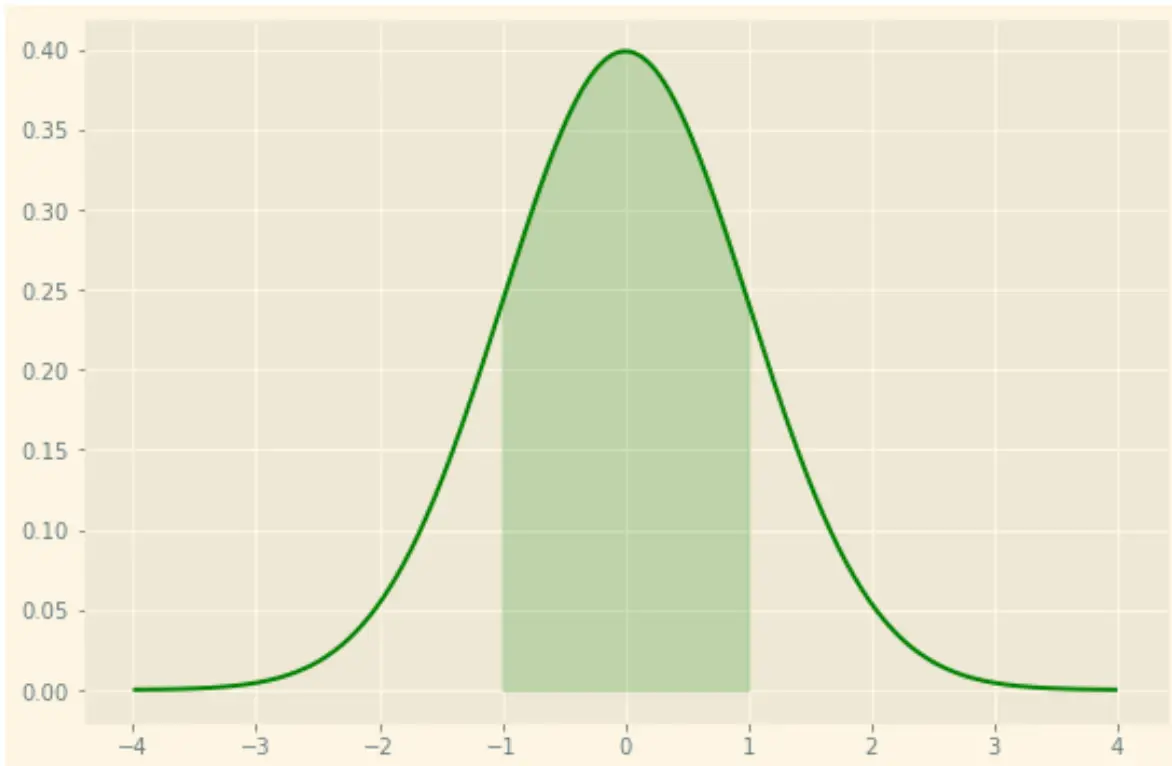
Ayrıca matplotlib’in birçok stil seçeneğini kullanarak çizimi istediğiniz gibi şekillendirebileceğinizi unutmayın. Örneğin, yeşil çizgi ve yeşil gölgeleme ile “güneş ışığı” temasını kullanabilirsiniz:
 x = np.arange(-4, 4, 0.001)
y = norm.pdf(x,0,1)

fig, ax = plt.subplots(figsize=(9,6))
ax.plot(x,y, color=' green ')

#specify the region of the bell curve to fill in
x_fill = np.arange(-1, 1, 0.001)
y_fill = norm.pdf(x_fill,0,1)
ax.fill_between(x_fill,y_fill,0, alpha=0.2, color=' green ')

plt.style.use(' Solarize_Light2 ')
plt.show()

Matplotlib için stil sayfası başvuru kılavuzunun tamamını burada bulabilirsiniz.