Matplotlib'de en boy oranı nasıl ayarlanır
Bir matplotlib grafiğinin en-boy oranı , eksen ölçeklendirmesinin en-boy oranını, yani y biriminin x birimine oranını ifade eder.
Bu oran matplotlib.axes.Axes.set_aspect() işlevi kullanılarak değiştirilebilir.
Aslında set_aspect() işlevi aslında veri koordinat sistemi adı verilen sistemi değiştirir, ancak pratikte genellikle ekran koordinat sistemini değiştirmek isteriz.
Bu dönüşümü kolaylaştırmak için şu kod parçasını kullanabiliriz:
 #define y-unit to x-unit ratio
ratio = 1.0

#get x and y limits
x_left, x_right = ax. get_xlim ()
y_low, y_high = ax. get_ylim ()

#set aspect ratio
ax. set_aspect ( abs ((x_right-x_left)/(y_low-y_high))*ratio)
Bu fonksiyonun pratikte kullanımına ilişkin bir örnek üzerinden geçelim.
Adım 1: Temel Matplotlib Grafiği Oluşturun
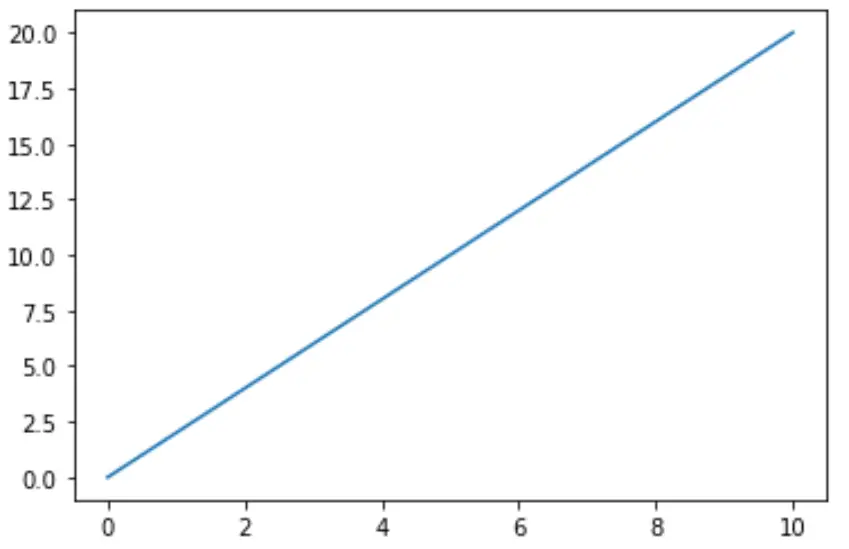
İlk önce Matplotlib’i kullanarak basit bir çizgi grafiği oluşturalım:
 import matplotlib.pyplot as plt

#define matplotlib figure and axis
fig, ax = plt. subplots ()

#create simple line plot
ax. plot ([0, 10],[0, 20])

#displayplot
plt. show ()
Adım 2: En boy oranını ayarlayın (yanlış şekilde)
X ekseninin y ekseninden daha uzun olduğuna dikkat edin. En boy oranını 1’e ayarlamaya çalışalım, yani x ekseni ve y ekseni eşit olmalıdır:
 import matplotlib.pyplot as plt

#define matplotlib figure and axis
fig, ax = plt. subplots ()

#create simple line plot
ax. plot ([0, 10],[0, 20])

#attempt to set aspect ratio to 1
ax. set_aspect (1)

#displayplot
plt. show ()
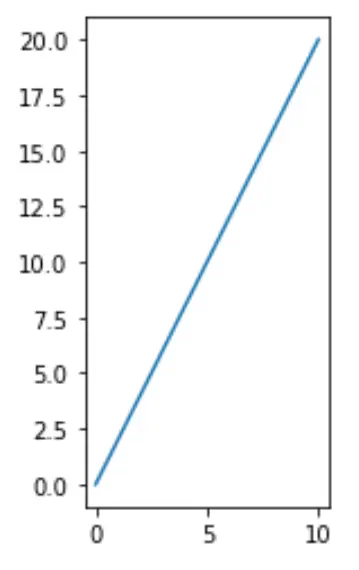
Bunun beklendiği gibi çalışmadığını unutmayın. Y ekseni x ekseninden çok daha uzundur.
3. Adım: En boy oranını ayarlayın (doğru şekilde)
Aşağıdaki kod, doğru en boy oranını ayarlamak için basit bir hesaplamanın nasıl kullanılacağını gösterir:
 import matplotlib.pyplot as plt

#define matplotlib figure and axis
fig, ax = plt. subplots ()

#create simple line plot
ax. plot ([0, 10],[0, 20])

#set aspect ratio to 1
ratio = 1.0
x_left, x_right = ax. get_xlim ()
y_low, y_high = ax. get_ylim ()
ax. set_aspect ( abs ((x_right-x_left)/(y_low-y_high))*ratio)

#displayplot
plt. show ()
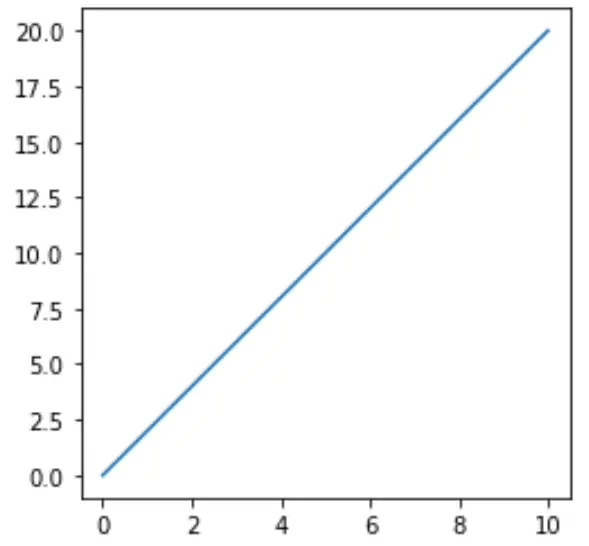
Bu grafiğin beklediğimiz en boy oranına sahip olduğunu unutmayın. X ekseni ve y ekseni uzunluk olarak eşittir.
4. Adım: En boy oranını istediğiniz gibi ayarlayın
Y ekseninin x ekseninden daha uzun olmasını istiyorsak en boy oranının 1’den büyük bir sayı olmasını basitçe belirtebiliriz:
 import matplotlib.pyplot as plt

#define matplotlib figure and axis
fig, ax = plt. subplots ()

#create simple line plot
ax. plot ([0, 10],[0, 20])

#set aspect ratio to 3
ratio = 3
x_left, x_right = ax. get_xlim ()
y_low, y_high = ax. get_ylim ()
ax. set_aspect ( abs ((x_right-x_left)/(y_low-y_high))*ratio)

#displayplot
plt. show ()
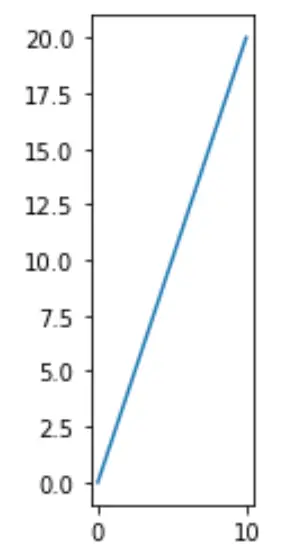
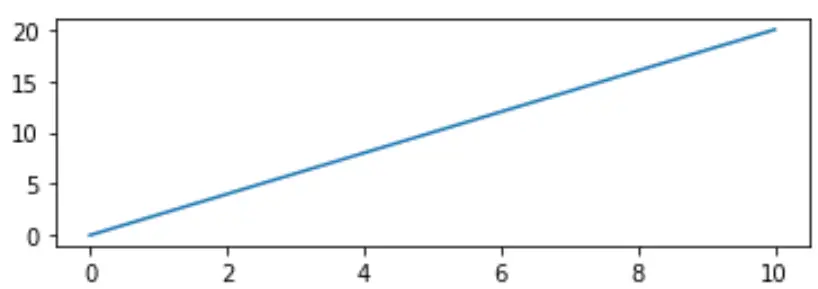
Y ekseninin x ekseninden daha kısa olmasını istiyorsak en boy oranının 1’den küçük bir sayı olmasını basitçe belirtebiliriz:
 import matplotlib.pyplot as plt

#define matplotlib figure and axis
fig, ax = plt. subplots ()

#create simple line plot
ax. plot ([0, 10],[0, 20])

#set aspect ratio to .3
ratio = .3
x_left, x_right = ax. get_xlim ()
y_low, y_high = ax. get_ylim ()
ax. set_aspect ( abs ((x_right-x_left)/(y_low-y_high))*ratio)

#displayplot
plt. show ()
Daha fazla Matplotlib eğitimini burada bulabilirsiniz.