Python'da en i̇yi uyum çizgisi nasıl çizilir (örneklerle)
Python’da en uygun çizgiyi çizmek için aşağıdaki temel sözdizimini kullanabilirsiniz:
 #find line of best fit
a, b = np. polyfit (x, y, 1)

#add points to plot
plt. scatter (x,y)

#add line of best fit to plot
plt. plot (x, a*x+b)
Aşağıdaki örnek, bu sözdiziminin pratikte nasıl kullanılacağını gösterir.
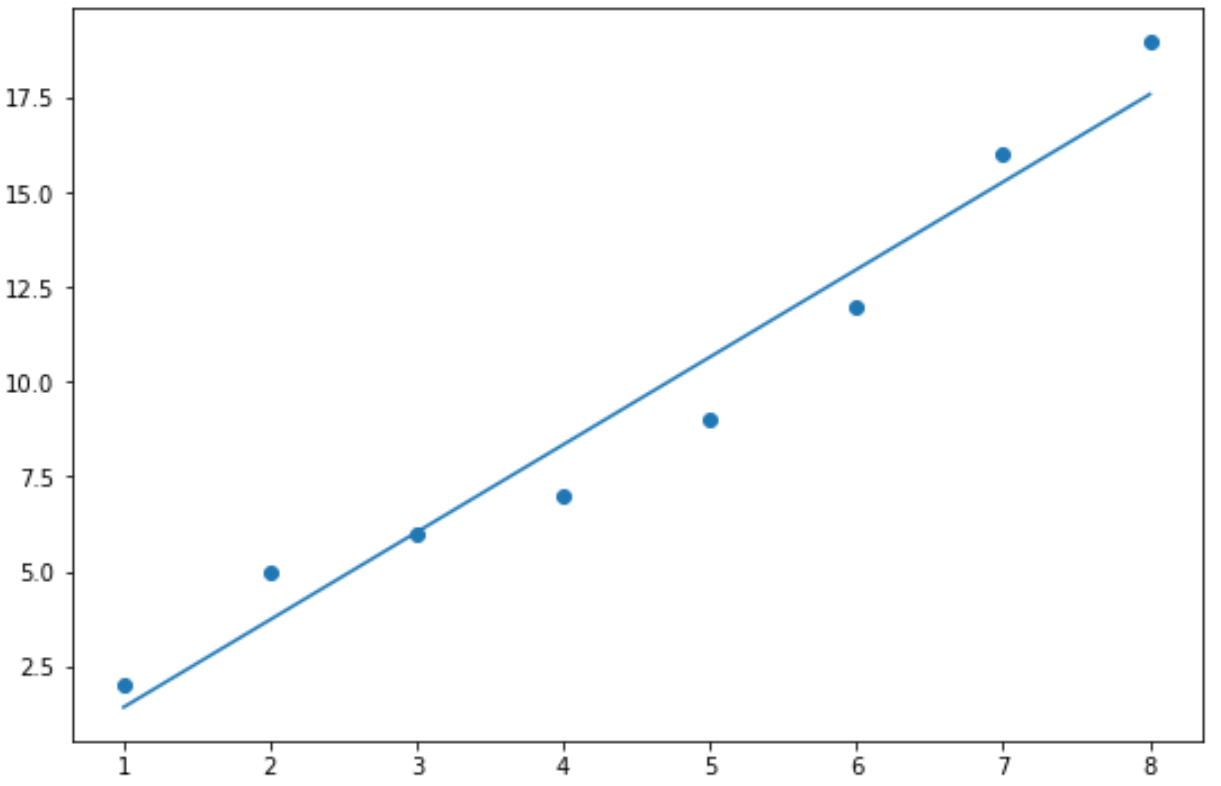
Örnek 1: Python’da En İyi Uyum Taban Çizgisini Çizmek
Aşağıdaki kod Python’da en uygun taban çizgisinin nasıl çizileceğini gösterir:
 import numpy as np
import matplotlib. pyplot as plt

#define data
x = np. array ([1, 2, 3, 4, 5, 6, 7, 8])
y = np. array ([2, 5, 6, 7, 9, 12, 16, 19])

#find line of best fit
a, b = np. polyfit (x, y, 1)

#add points to plot
plt. scatter (x,y)

#add line of best fit to plot
plt. plot (x, a*x+b)

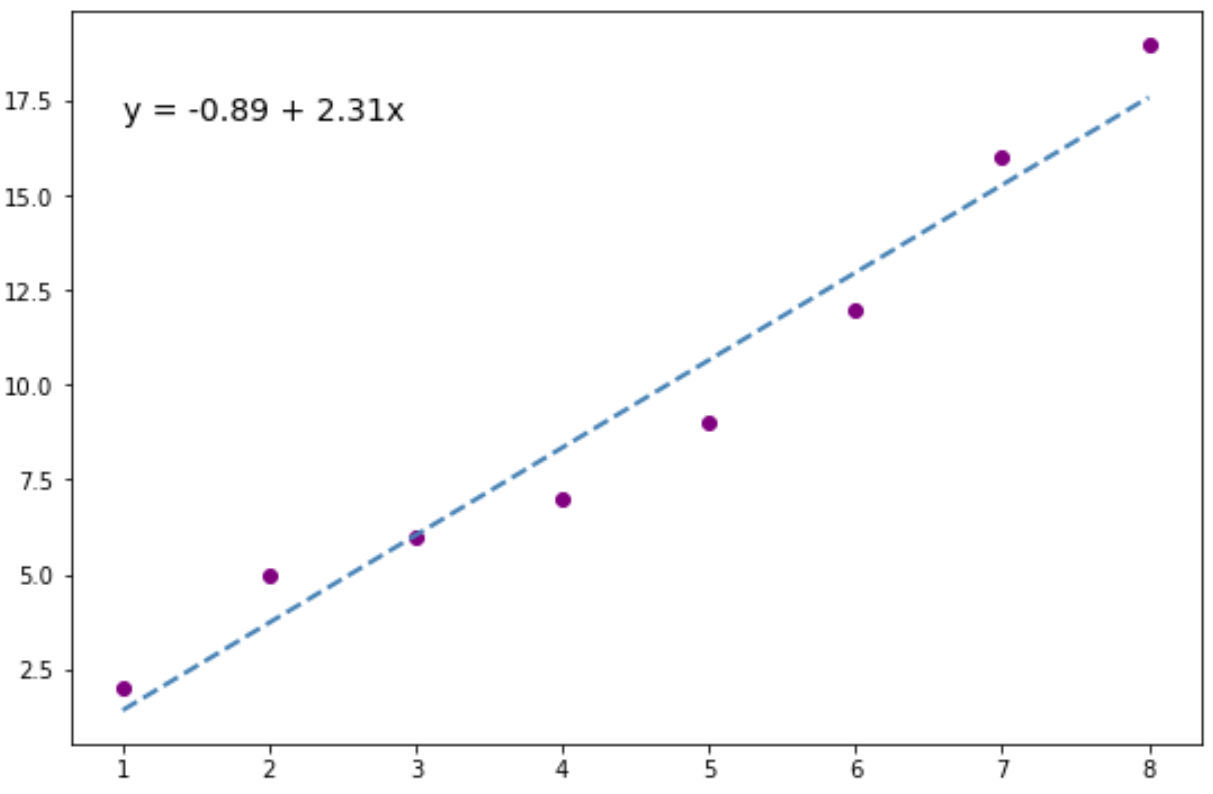
Örnek 2: Python’da En Uygun Özel Çizgiyi Çizme
Aşağıdaki kod, önceki örnekle aynı en uygun çizginin aşağıdaki eklemelerle nasıl oluşturulacağını gösterir:
- Noktalar ve en uygun çizgi için özel renkler
- En iyi uyum çizgisi için özel stil ve genişlik
- Grafikte görüntülenen takılan regresyon çizgisinin denklemi
 import numpy as np
import matplotlib. pyplot as plt

#define data
x = np. array ([1, 2, 3, 4, 5, 6, 7, 8])
y = np. array ([2, 5, 6, 7, 9, 12, 16, 19])

#find line of best fit
a, b = np. polyfit (x, y, 1)

#add points to plot
plt. scatter (x,y,color=' purple ')

#add line of best fit to plot
plt. plot (x, a*x+b, color=' steelblue ', linestyle=' -- ', linewidth= 2 )

#add fitted regression equation to plot
plt. text (1, 17, 'y = ' + '{:.2f}'. format (b) + ' + {:.2f}'. format (a) + 'x', size= 14 )

Uygun regresyon denklemini çizimde istediğiniz (x,y) koordinatlarına yerleştirmekten çekinmeyin.
Bu özel örnek için (x, y) = (1, 17)’yi seçtik.
Ek kaynaklar
Aşağıdaki eğitimlerde Python’da farklı regresyon modellerinin nasıl uygulanacağı açıklanmaktadır:
Python’da Doğrusal Regresyon İçin Tam Bir Kılavuz
Python’da polinom regresyonu nasıl gerçekleştirilir
Python’da niceliksel regresyon nasıl gerçekleştirilir