Matplotlib'de fig.add_subplot nasıl kullanılır
Matplotlib’de alt noktalar oluşturmak için aşağıdaki temel sözdizimini kullanabilirsiniz:
 import matplotlib. pyplot as plt

#define figure
fig = plt. figure ()

#add first subplot in layout that has 3 rows and 2 columns
fig. add_subplot (321)

#add fifth subplot in layout that has 3 rows and 2 columns
fig. add_subplot (325)

...
Aşağıdaki örnekler bu sözdiziminin pratikte nasıl kullanılacağını göstermektedir.
Örnek 1: Tekdüzen Düzene Sahip Alt Grafikler Ekleme
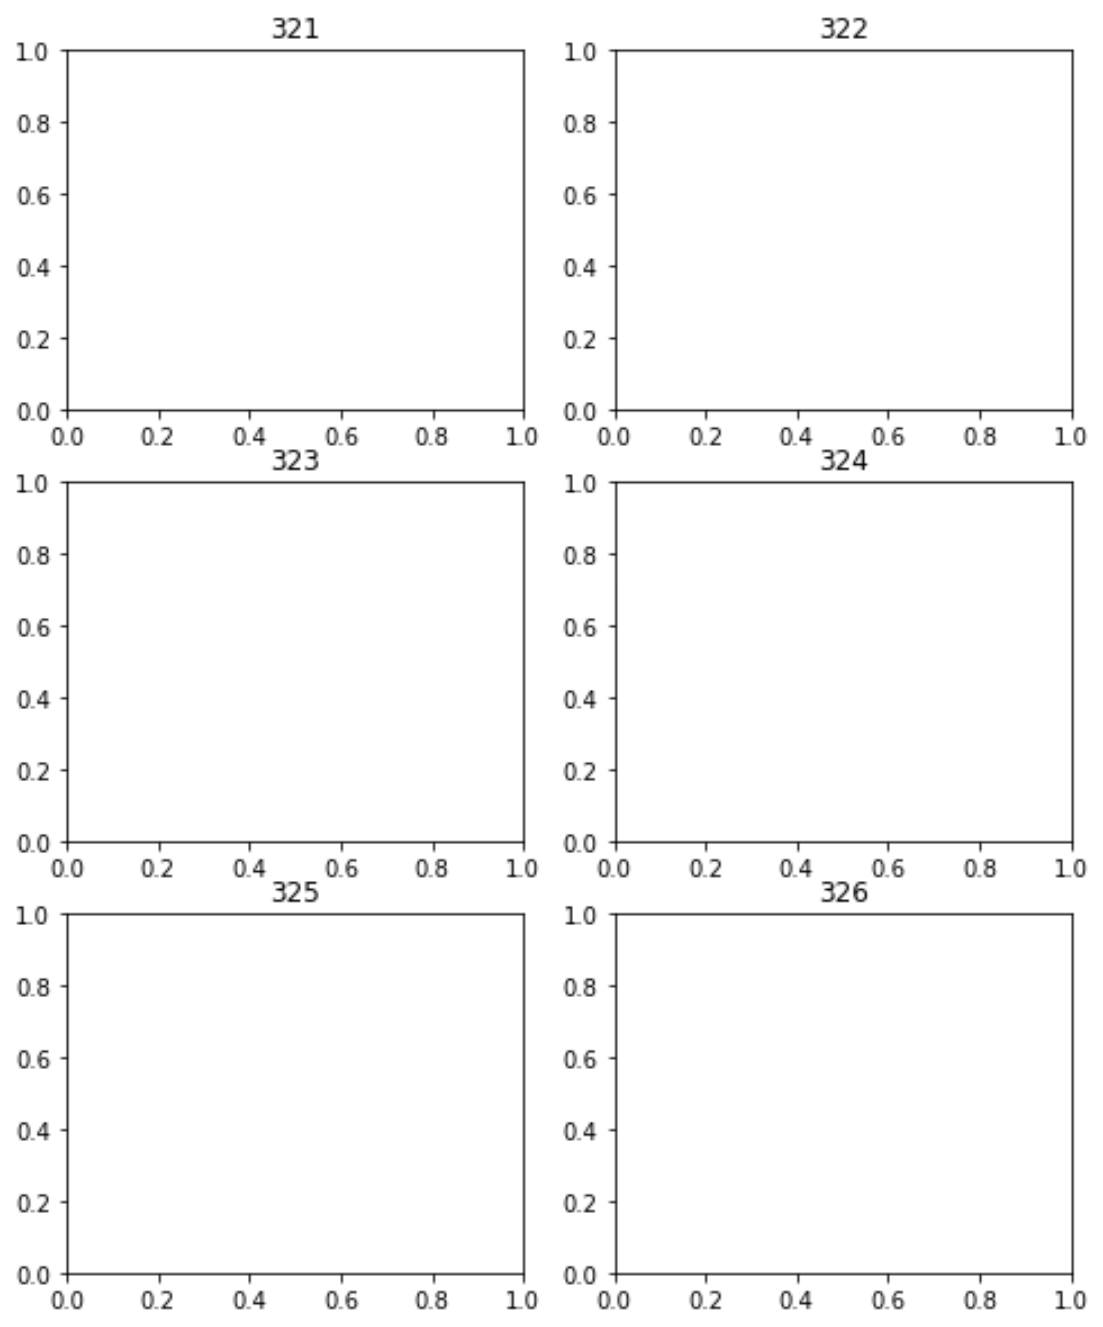
Aşağıdaki kod, 3 satır ve 2 sütunlu bir düzende altı alt grafiğin nasıl oluşturulacağını gösterir:
 import matplotlib. pyplot as plt

#define figure
fig = plt. figure ()

#add subplots
fig. add_subplot (321). set_title (' 321 ')
fig. add_subplot (322). set_title (' 322 ')
fig. add_subplot (323). set_title (' 323 ')
fig. add_subplot (324). set_title (' 324 ')
fig. add_subplot (325). set_title (' 325 ')
fig. add_subplot (326). set_title (' 326 ')

#display plots
plt. show ()

Sonucun, 3 satır ve 2 sütundan oluşan bir düzende görüntülenen altı alt grafik olduğunu unutmayın.
Örnek 2: Düzensiz Düzene Sahip Alt Grafikler Ekleme
Aşağıdaki kod, dört alt grafiğin nasıl oluşturulacağını gösterir:
- Parsellerin üçü, 3 satır ve 2 sütundan oluşan bir ızgarada oluşturulmuştur.
- Dördüncü arsa, 1 satır ve 2 sütundan oluşan bir ızgarada oluşturulur.
 import matplotlib. pyplot as plt

#define figure
fig = plt. figure ()

#add subplots
fig. add_subplot (321). set_title (' 321 ')
fig. add_subplot (323). set_title (' 323 ')
fig. add_subplot (325). set_title (' 325 ')
fig. add_subplot (122). set_title (' 122 ')

#display plots
plt. show ()

Nihai sonuç, 3×2’lik bir ızgarada görüntülenen üç alt grafiktir, son alt grafik ise 1×2’lik bir ızgarada görüntülenir.
Ek kaynaklar
Aşağıdaki eğitimler Matplotlib’de diğer genel işlemlerin nasıl gerçekleştirileceğini açıklamaktadır:
Matplotlib alt noktaları arasındaki boşluk nasıl ayarlanır?
Matplotlib’de alt grafik boyutu nasıl ayarlanır
Matplotlib’deki alt noktalara başlık nasıl eklenir