Matplotlib'de tight_layout() nasıl kullanılır
Alt noktalar arasındaki ve çevresindeki dolguyu otomatik olarak ayarlamak için Matplotlib’deki Tight_layout() işlevini kullanabilirsiniz.
Aşağıdaki örnekte bu fonksiyonun pratikte nasıl kullanılacağı gösterilmektedir.
Örnek: Matplotlib’de Tight_layout() nasıl kullanılır?
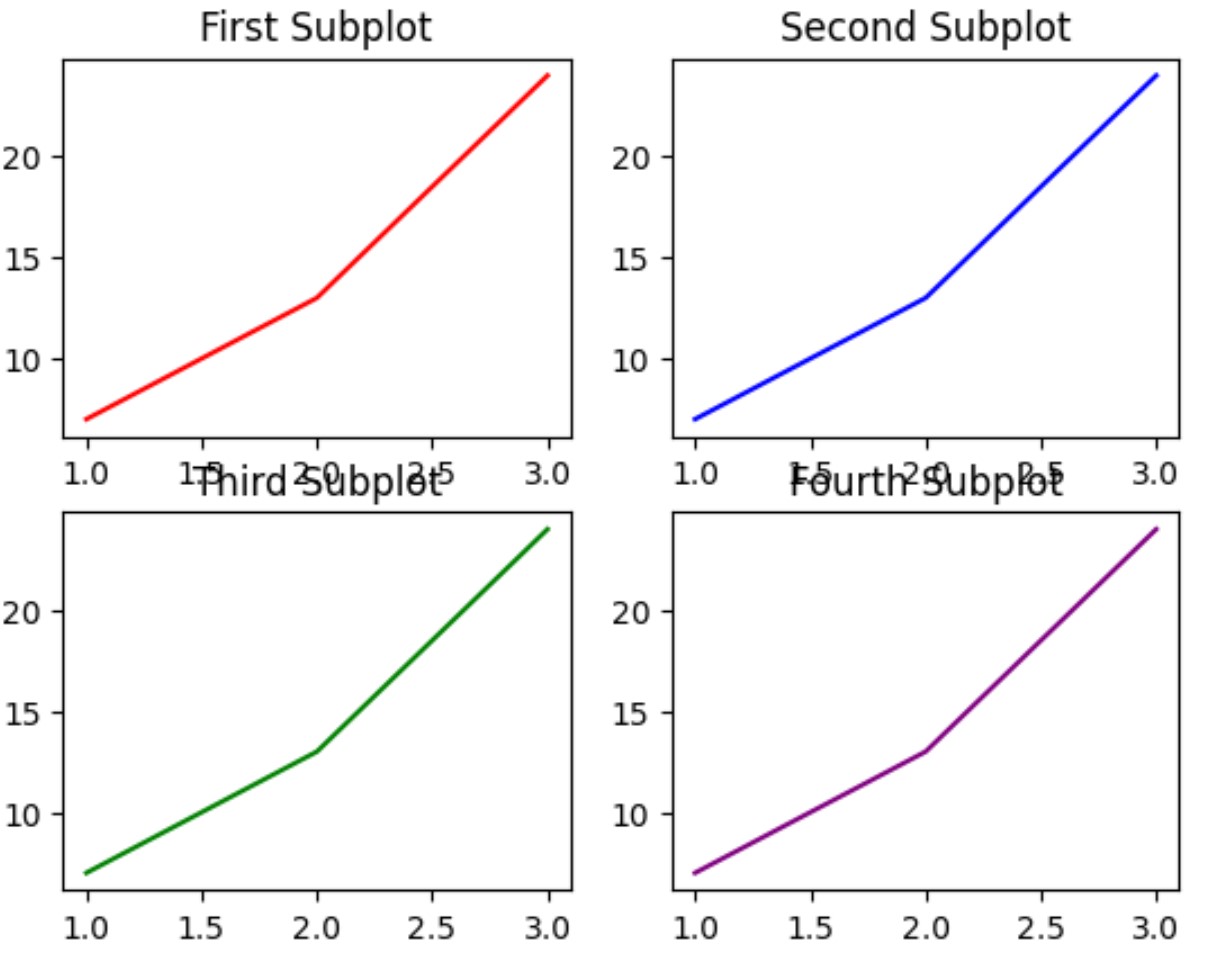
2×2’lik bir ızgarada dört alt grafik oluşturmak için Matplotilb’i kullandığımızı varsayalım:
 import matplotlib. pyplot as plt

#define data
x = [1, 2, 3]
y = [7, 13, 24]

#define layout for subplots
fig, ax = plt. subplots (2, 2)

#define subplot titles
ax[0, 0]. plot (x,y,color=' red ')
ax[0, 1]. plot (x,y,color=' blue ')
ax[1, 0]. plot (x,y,color=' green ')
ax[1, 1]. plot (x,y,color=' purple ')

#add title to each subplot
ax[0, 0]. set_title (' First Subplot ')
ax[0, 1]. set_title (' Second Subplot ')
ax[1, 0]. set_title (' Third Subplot ')
ax[1, 1]. set_title (' Fourth Subplot ')

Alt noktalar arasında çok az dolgu bulunduğunu ve bu durumun bazı yerlerde başlıkların çakışmasına neden olduğunu unutmayın.
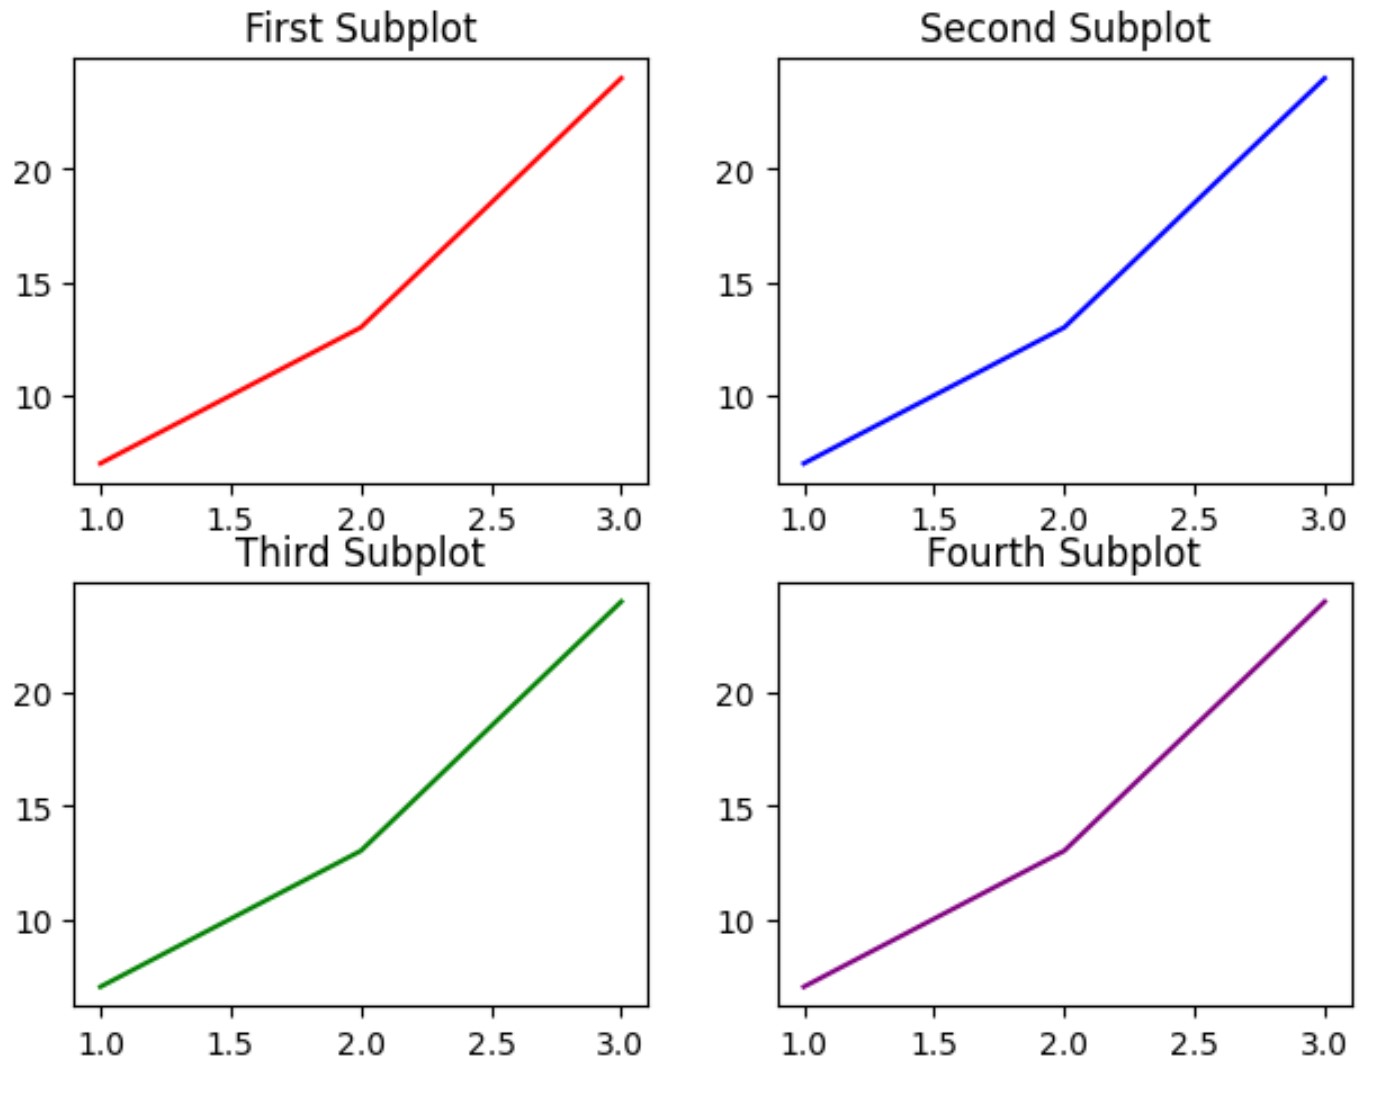
fig.tight_layout() öğesini belirterek alt noktalar arasındaki ve etrafındaki dolguyu otomatik olarak ayarlayabiliriz:
 import matplotlib. pyplot as plt

#define data
x = [1, 2, 3]
y = [7, 13, 24]

#define layout for subplots
fig, ax = plt. subplots (2, 2)

#specify a tight layout
fig. tight_layout ()

#define subplot titles
ax[0, 0]. plot (x,y,color=' red ')
ax[0, 1]. plot (x,y,color=' blue ')
ax[1, 0]. plot (x,y,color=' green ')
ax[1, 1]. plot (x,y,color=' purple ')

#add title to each subplot
ax[0, 0]. set_title (' First Subplot ')
ax[0, 1]. set_title (' Second Subplot ')
ax[1, 0]. set_title (' Third Subplot ')
ax[1, 1]. set_title (' Fourth Subplot ')

Alt noktalar arasındaki ve çevresindeki dolgunun, çizimler artık hiçbir alanda üst üste gelmeyecek şekilde ayarlandığını unutmayın.
Tight_layout() işlevinin, şeklin kenarı ile alt yol kenarları arasındaki dolguyu yazı tipi boyutunun bir kesri olarak belirtmek için bir ped argümanı aldığını unutmayın.
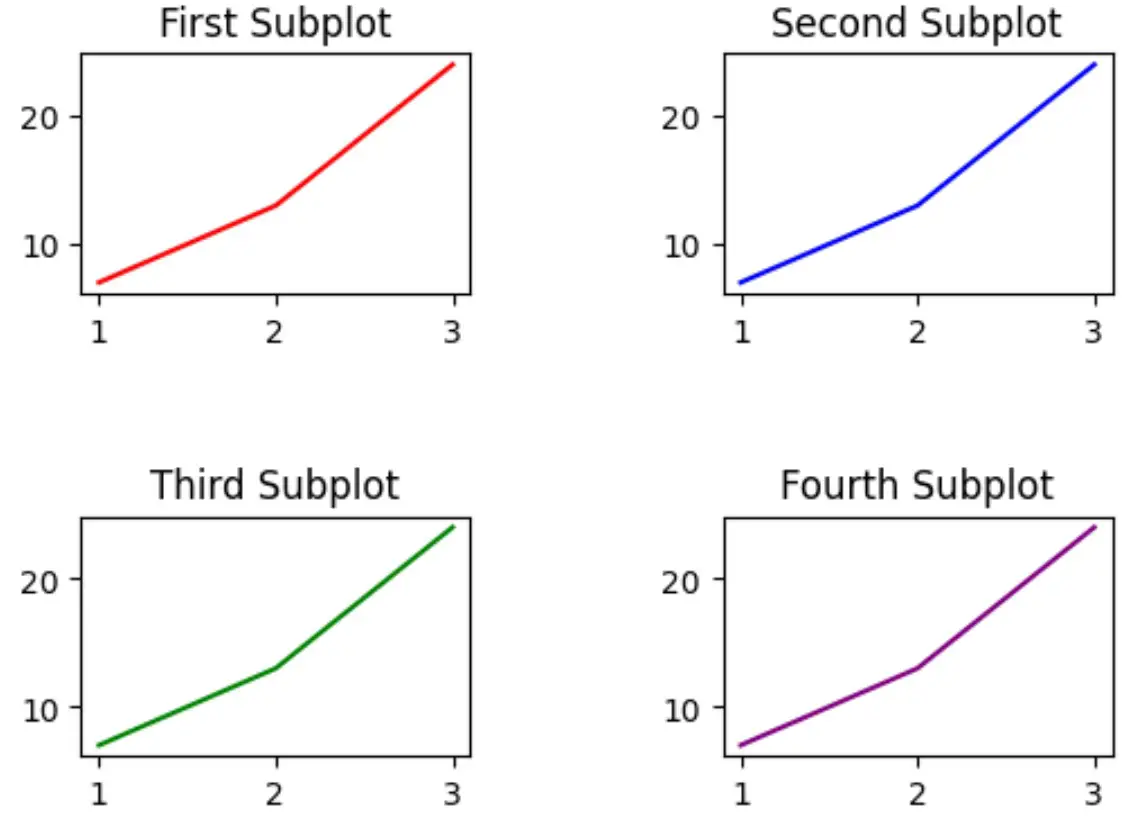
Varsayılan ped değeri 1,08’dir . Ancak yolların etrafındaki dolguyu artırmak için bu değeri artırabiliriz:
 import matplotlib. pyplot as plt

#define data
x = [1, 2, 3]
y = [7, 13, 24]

#define layout for subplots
fig, ax = plt. subplots (2, 2)

#specify a tight layout with increased padding
fig. tight_layout (pad=5)

#define subplot titles
ax[0, 0]. plot (x,y,color=' red ')
ax[0, 1]. plot (x,y,color=' blue ')
ax[1, 0]. plot (x,y,color=' green ')
ax[1, 1]. plot (x,y,color=' purple ')

#add title to each subplot
ax[0, 0]. set_title (' First Subplot ')
ax[0, 1]. set_title (' Second Subplot ')
ax[1, 0]. set_title (' Third Subplot ')
ax[1, 1]. set_title (' Fourth Subplot ')

Parsellerin etrafındaki dolgunun belirgin şekilde arttığını unutmayın.
Yolların etrafındaki dolguyu istediğiniz kadar artırmak için pad argümanının değerini ayarlamaktan çekinmeyin.
Ek kaynaklar
Aşağıdaki eğitimler Matplotlib’deki diğer ortak görevlerin nasıl gerçekleştirileceğini açıklamaktadır:
Matplotlib’deki alt noktalara başlık nasıl eklenir
Matplotlib’de alt grafik boyutu nasıl ayarlanır
Matplotlib alt noktaları arasındaki boşluk nasıl ayarlanır?