Matplotlib'de eksenleri gizleme (örneklerle)
Matplotlib grafiklerinde eksenleri gizlemek için aşağıdaki sözdizimini kullanabilirsiniz:
 import matplotlib. pyplot as plt

#get current axes
ax = plt. gca ()

#hide x-axis
ax. get_xaxis (). set_visible ( False )

#hide y-axis
ax. get_yaxis (). set_visible ( False )
Aşağıdaki örnekler bu sözdiziminin pratikte nasıl kullanılacağını göstermektedir.
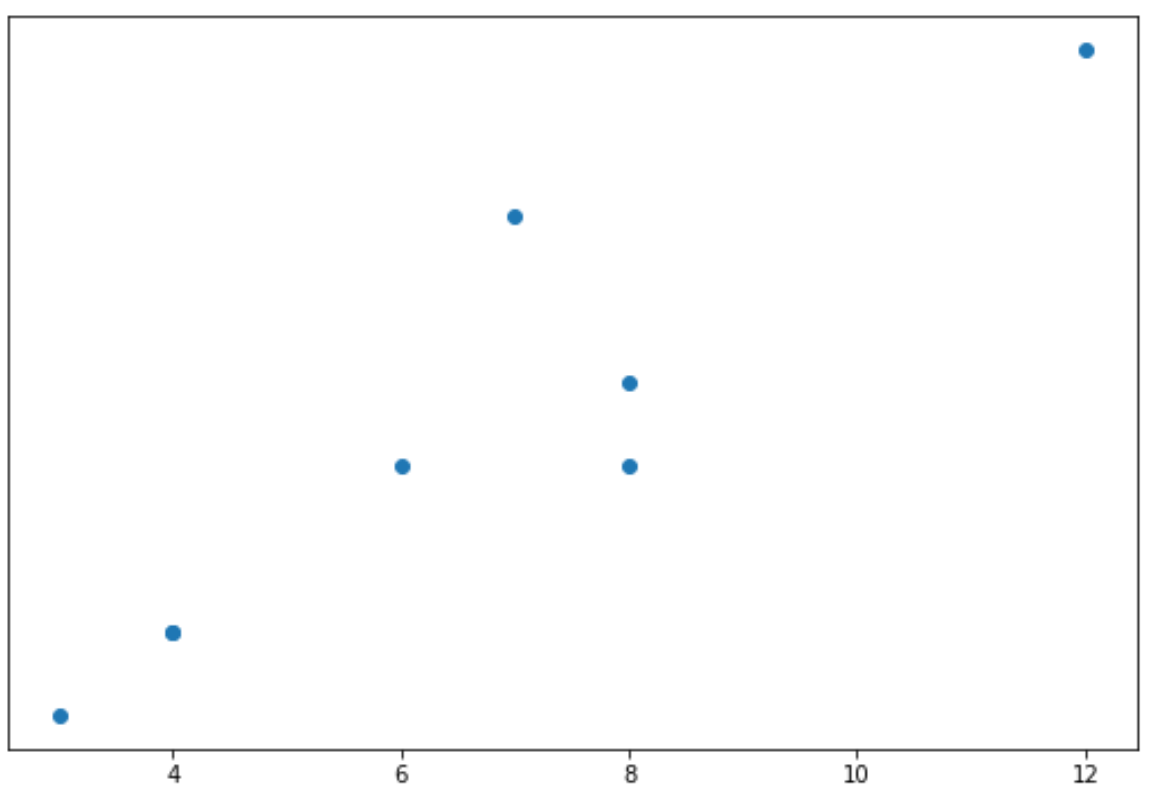
Örnek 1: X eksenini gizleyin
Aşağıdaki kod, dağılım grafiğinin nasıl oluşturulacağını ve x ekseninin nasıl gizleneceğini gösterir:
 import matplotlib. pyplot as plt

#define data
x = [3, 4, 4, 6, 7, 8, 8, 12]
y = [11, 12, 12, 14, 17, 15, 14, 19]

#create scatterplot
plt. scatter (x,y)

#get current axes
ax = plt. gca ()

#hide x-axis
ax. get_xaxis (). set_visible ( False )
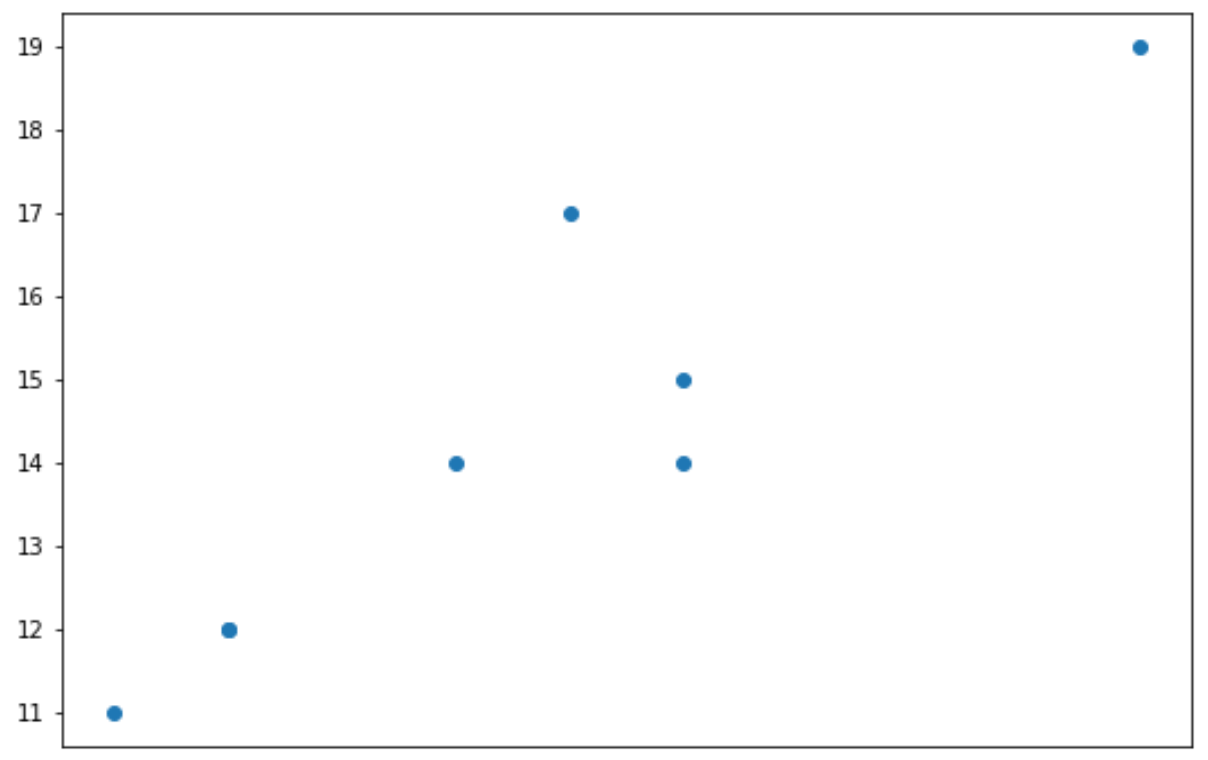
Örnek 2: Y eksenini gizleyin
Aşağıdaki kod, dağılım grafiğinin nasıl oluşturulacağını ve Y ekseninin nasıl gizleneceğini gösterir:
 import matplotlib. pyplot as plt

#define data
x = [3, 4, 4, 6, 7, 8, 8, 12]
y = [11, 12, 12, 14, 17, 15, 14, 19]

#create scatterplot
plt. scatter (x,y)

#get current axes
ax = plt. gca ()

#hide y-axis
ax. get_yaxis (). set_visible ( False )
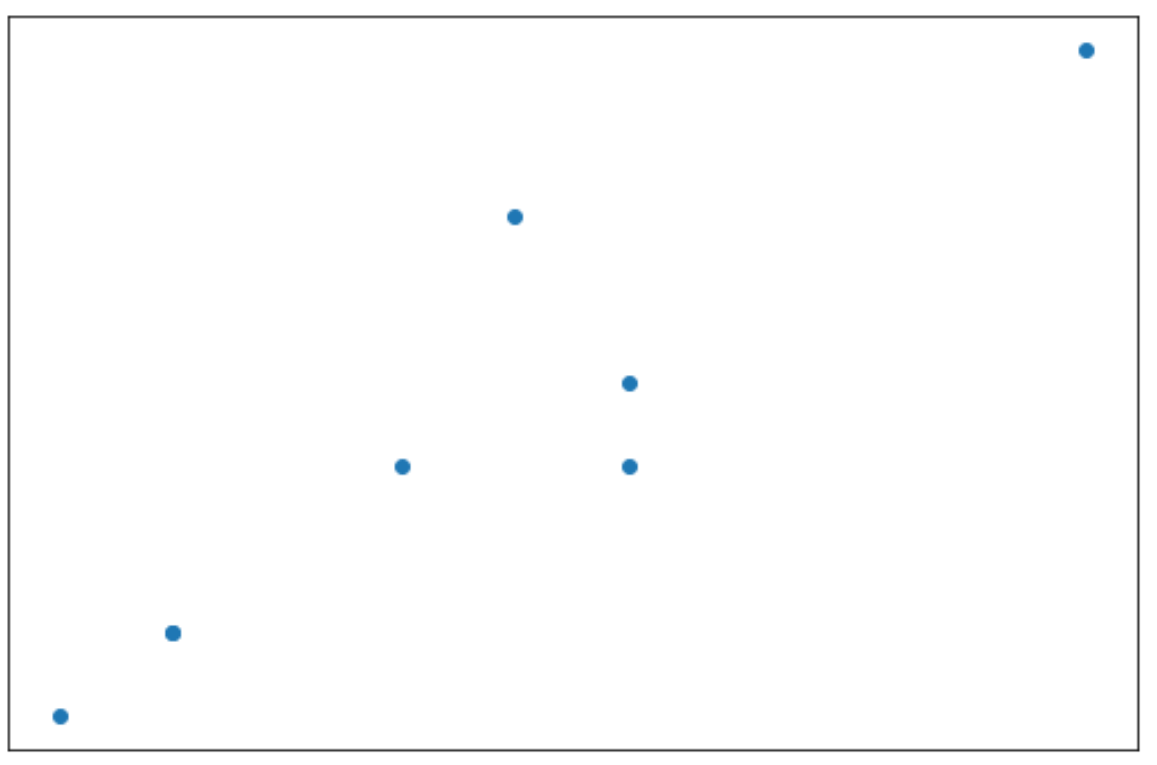
Örnek 3: Her iki ekseni de gizle
Aşağıdaki kod, hem dağılım grafiğinin hem de eksenlerin gizlenmesinin nasıl oluşturulacağını gösterir:
 import matplotlib. pyplot as plt

#define data
x = [3, 4, 4, 6, 7, 8, 8, 12]
y = [11, 12, 12, 14, 17, 15, 14, 19]

#create scatterplot
plt. scatter (x,y)

#get current axes
ax = plt. gca ()

#hide x-axis
ax. get_xaxis (). set_visible ( False )

#hide y-axis
ax. get_yaxis (). set_visible ( False )
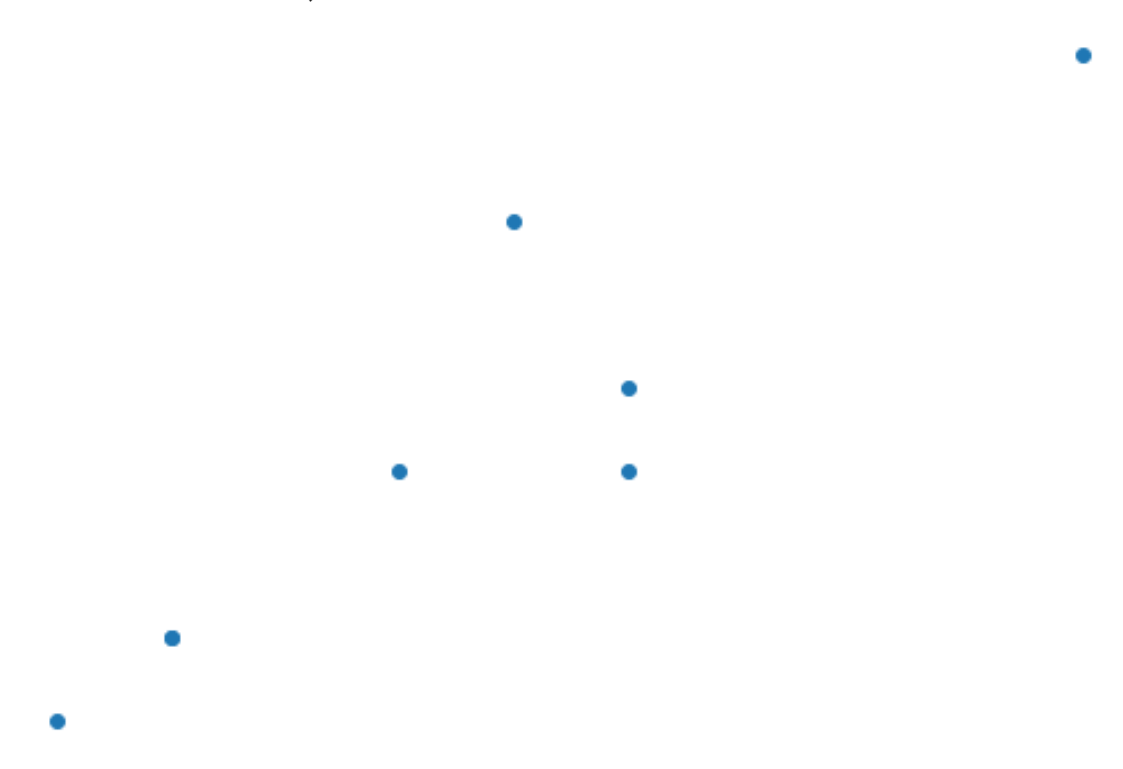
Örnek 4: Eksenleri ve sınırları tamamen kaldırın
Aşağıdaki kod eksenlerin ve kenarlıkların çizimden nasıl tamamen kaldırılacağını gösterir:
 import matplotlib. pyplot as plt

#define data
x = [3, 4, 4, 6, 7, 8, 8, 12]
y = [11, 12, 12, 14, 17, 15, 14, 19]

#create scatterplot
plt. scatter (x,y)

#get current axes
ax = plt. gca ()

#hide axes and borders
plt. axis (' off ')
Ek kaynaklar
Matplotlib’deki kenelerin sayısı nasıl değiştirilir?
Matplotlib’de onay işareti etiketleri nasıl döndürülür
Matplotlib’de eksen aralıkları nasıl ayarlanır
yazar hakkında
Dr.benjamin anderson
Merhaba, ben Benjamin, emekli bir istatistik profesörü ve Statorials öğretmenine dönüştüm. İstatistik alanındaki kapsamlı deneyimim ve uzmanlığımla, öğrencilerimi Statorials aracılığıyla güçlendirmek için bilgilerimi paylaşmaya can atıyorum. Daha fazlasını bil