Python'da matplotlib kullanarak şamdan grafiği nasıl oluşturulur
Mum grafiği, menkul kıymetlerin zaman içindeki fiyat hareketlerini gösteren bir tür finansal grafiktir.
Aşağıdaki örnek, Python’daki Matplotlib görselleştirme kitaplığını kullanarak bir mum çubuğu grafiğinin nasıl oluşturulacağını gösterir.
Örnek: Python’da Mum Grafiği Oluşturma
Diyelim ki, belirli bir hisse senedinin 8 günlük bir süre içindeki açılış, kapanış, yüksek ve düşük fiyatını gösteren aşağıdaki pandalar DataFrame’e sahibiz:
 import pandas as pd

#createDataFrame
prices = pd. DataFrame ({' open ': [25, 22, 21, 19, 23, 21, 25, 29],
                       ' close ': [24, 20, 17, 23, 22, 25, 29, 31],
                       ' high ': [28, 27, 29, 25, 24, 26, 31, 37],
                       ' low ': [22, 16, 14, 17, 19, 18, 22, 26]},
                       index=pd. date_range (" 2021-01-01 ", periods=8, freq=" d "))

#display DataFrame
print (prices)

            open close high low
2021-01-01 25 24 28 22
2021-01-02 22 20 27 16
2021-01-03 21 17 29 14
2021-01-04 19 23 25 17
2021-01-05 23 22 24 19
2021-01-06 21 25 26 18
2021-01-07 25 29 31 22
2021-01-08 29 31 37 26
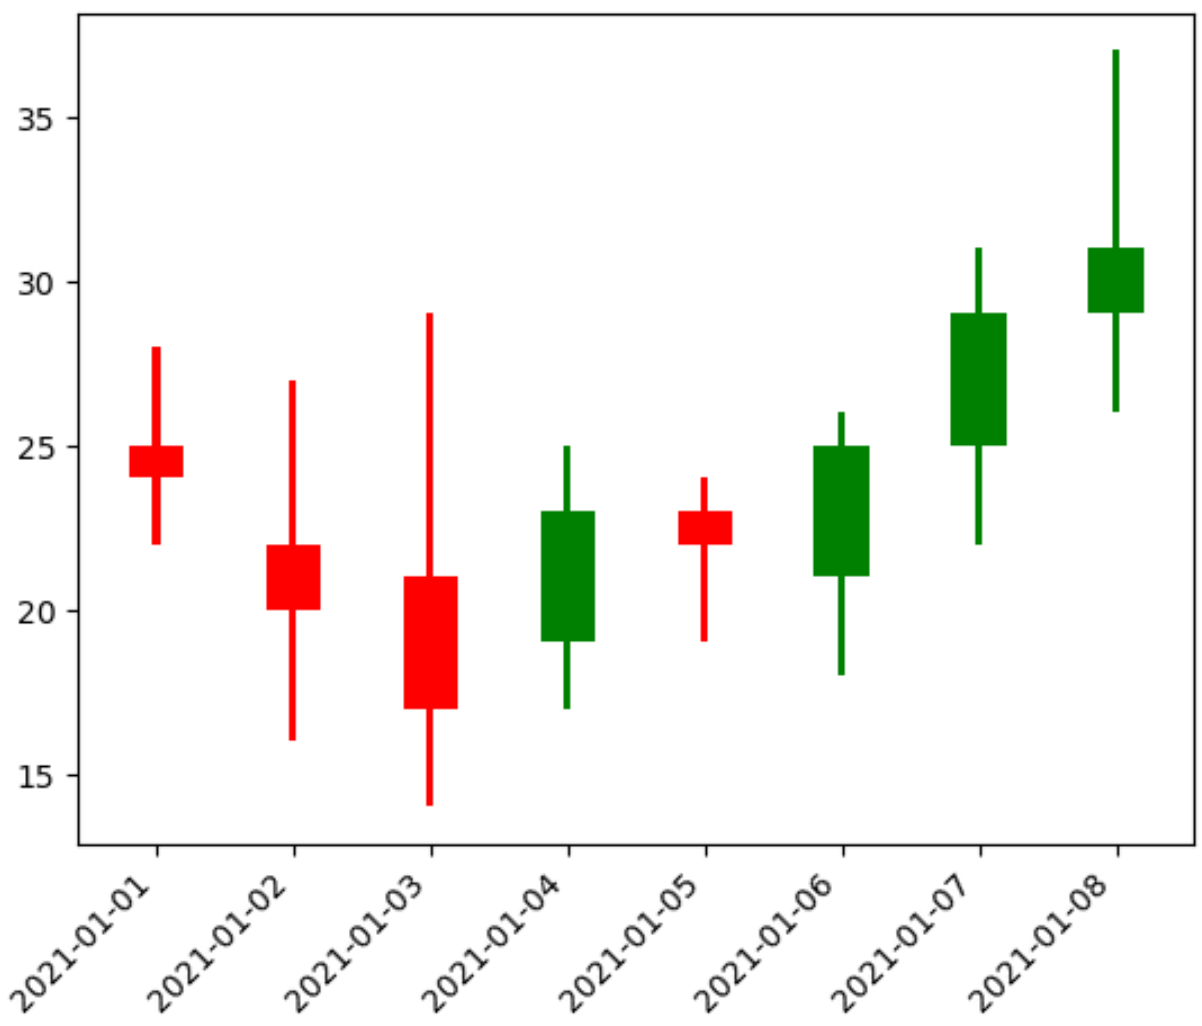
Bu hisse senedinin bu 8 günlük dönemdeki fiyat hareketlerini görselleştirmek amacıyla bir mum grafiği oluşturmak için aşağıdaki kodu kullanabiliriz:
 import matplotlib. pyplot as plt

#create figure
plt. figure ()

#define width of candlestick elements
width = .4
width2 = .05

#define up and down prices
up = prices[prices. close >=prices. open ]
down = prices[prices. close <prices. open ]

#define colors to use
col1 = ' green '
col2 = ' red '

#plot up prices
plt. bar (up. index , up. close -up. open , width, bottom=up. open , color=col1)
plt. bar (up. index ,up. high -up. close ,width2,bottom=up. close ,color=col1)
plt. bar (up. index , up. low -up. open , width2, bottom=up. open , color=col1)

#plot down prices
plt. bar (down. index , down. close -down. open , width, bottom=down. open , color=col2)
plt. bar (down. index , down. high -down. open , width2, bottom=down. open , color=col2)
plt. bar (down. index ,down. low -down. close ,width2,bottom=down. close ,color=col2)

#rotate x-axis tick labels
plt. xticks (rotation= 45 , ha=' right ')

#display candlestick chart
plt. show ()

Her bir mum çubuğu, belirli bir günde menkul kıymetin fiyatındaki değişimi temsil eder. Mum çubuğunun rengi bize fiyatın bir önceki güne göre daha yüksek mi (yeşil) yoksa daha düşük mi (kırmızı) kapandığını söyler.
Grafiğin istediğiniz gibi görünmesini sağlamak için mum çubuklarının genişliğini ve kullanılan renkleri değiştirmekten çekinmeyin.
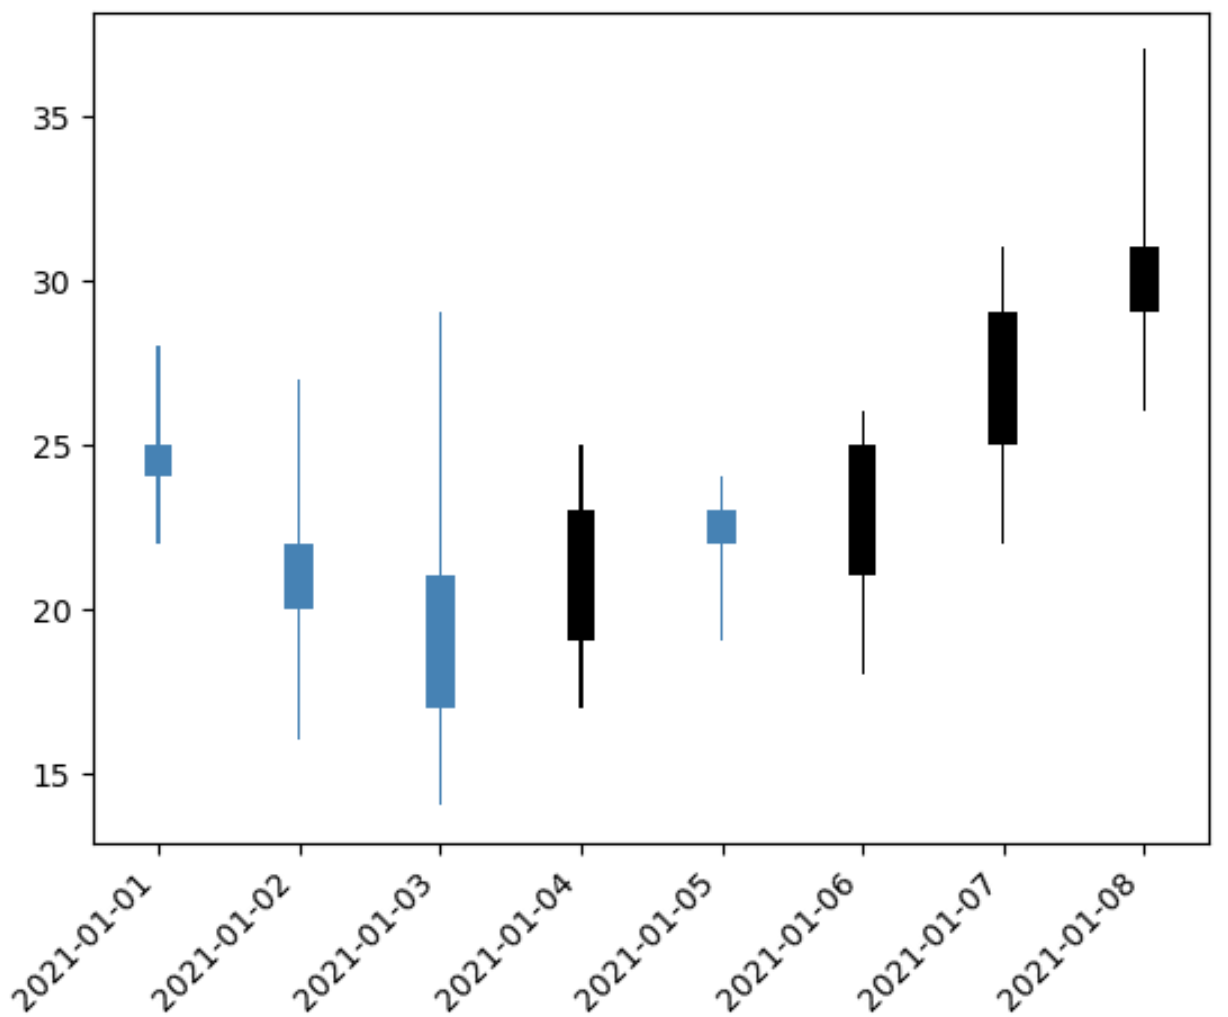
Örneğin, mumları daha da inceltebilir ve “yüksek” ve “düşük” günleri temsil etmek için farklı renkler kullanabiliriz:
 import matplotlib. pyplot as plt

#create figure
plt. figure ()

#define width of candlestick elements
width = .2
width2 = .02

#define up and down prices
up = prices[prices. close >=prices. open ]
down = prices[prices. close <prices. open ]

#define colors to use
col1 = ' black '
col2 = ' steelblue '

#plot up prices
plt. bar (up. index , up. close -up. open , width, bottom=up. open , color=col1)
plt. bar (up. index ,up. high -up. close ,width2,bottom=up. close ,color=col1)
plt. bar (up. index , up. low -up. open , width2, bottom=up. open , color=col1)

#plot down prices
plt. bar (down. index , down. close -down. open , width, bottom=down. open , color=col2)
plt. bar (down. index , down. high -down. open , width2, bottom=down. open , color=col2)
plt. bar (down. index ,down. low -down. close ,width2,bottom=down. close ,color=col2)

#rotate x-axis tick labels
plt. xticks (rotation= 45 , ha=' right ')

#display candlestick chart
plt. show ()

Ek kaynaklar
Aşağıdaki eğitimlerde Python’da diğer yaygın grafiklerin nasıl oluşturulacağı açıklanmaktadır:
Tek bir şekilde birden fazla Matplotlib grafiği nasıl oluşturulur?
Python’daki bir veri listesinden histogram nasıl çizilir
Python’da Gruba Göre Kutu Grafikleri Nasıl Oluşturulur