Matplotlib'de zaman serisi nasıl çizilir (örneklerle)
Matplotlib’de bir zaman serisi çizmek için aşağıdaki sözdizimini kullanabilirsiniz:
 import matplotlib. pyplot as plt

plt. plot (df. x , df. y )
Bu, x değişkeninin datetime.datetime() sınıfına ait olduğunu varsayar.
Aşağıdaki örnekler Python’da zaman serisi verilerini çizmek için bu sözdiziminin nasıl kullanılacağını gösterir.
Örnek 1: Matplotlib’de temel bir zaman serisinin grafiğini çizme
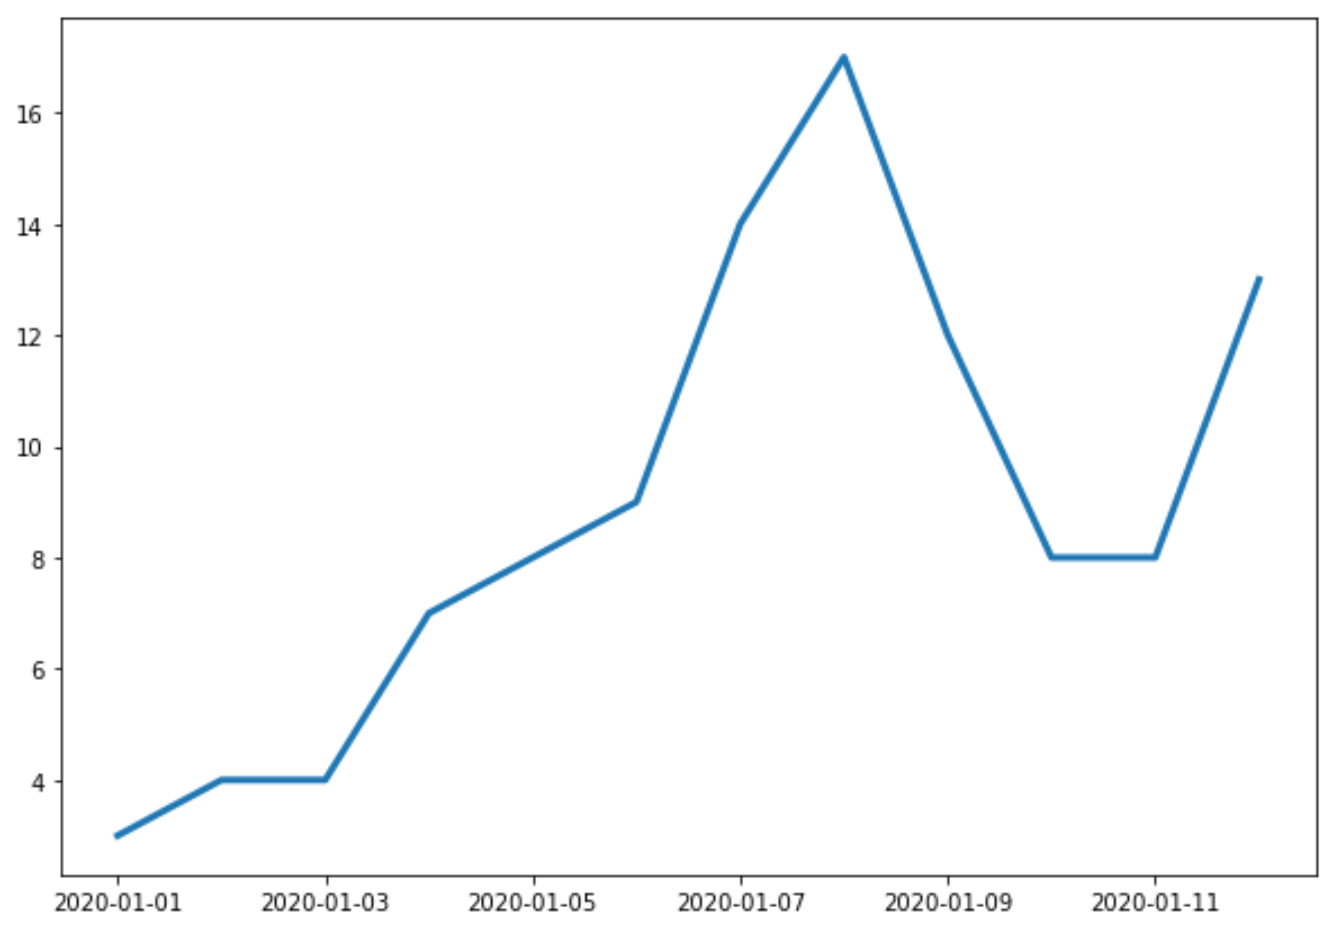
Aşağıdaki kod, bir işletmenin ardışık 12 gün boyunca yaptığı toplam satışları gösteren Matplotlib’de bir zaman serisinin nasıl çizileceğini gösterir:
 import matplotlib. pyplot as plt
import datetime
import numpy as np
import pandas as pd

#define data
df = pd. DataFrame ({' date ': np. array ([datetime. datetime (2020, 1, i+1)
for i in range(12)]),
                   ' sales ': [3, 4, 4, 7, 8, 9, 14, 17, 12, 8, 8, 13]})

#plot time series
plt. plot (df. date , df. sales , linewidth= 3 )

X ekseni tarihi, Y ekseni ise her tarihteki toplam satışları gösterir.
Örnek 2: Başlık ve eksen etiketlerini özelleştirme
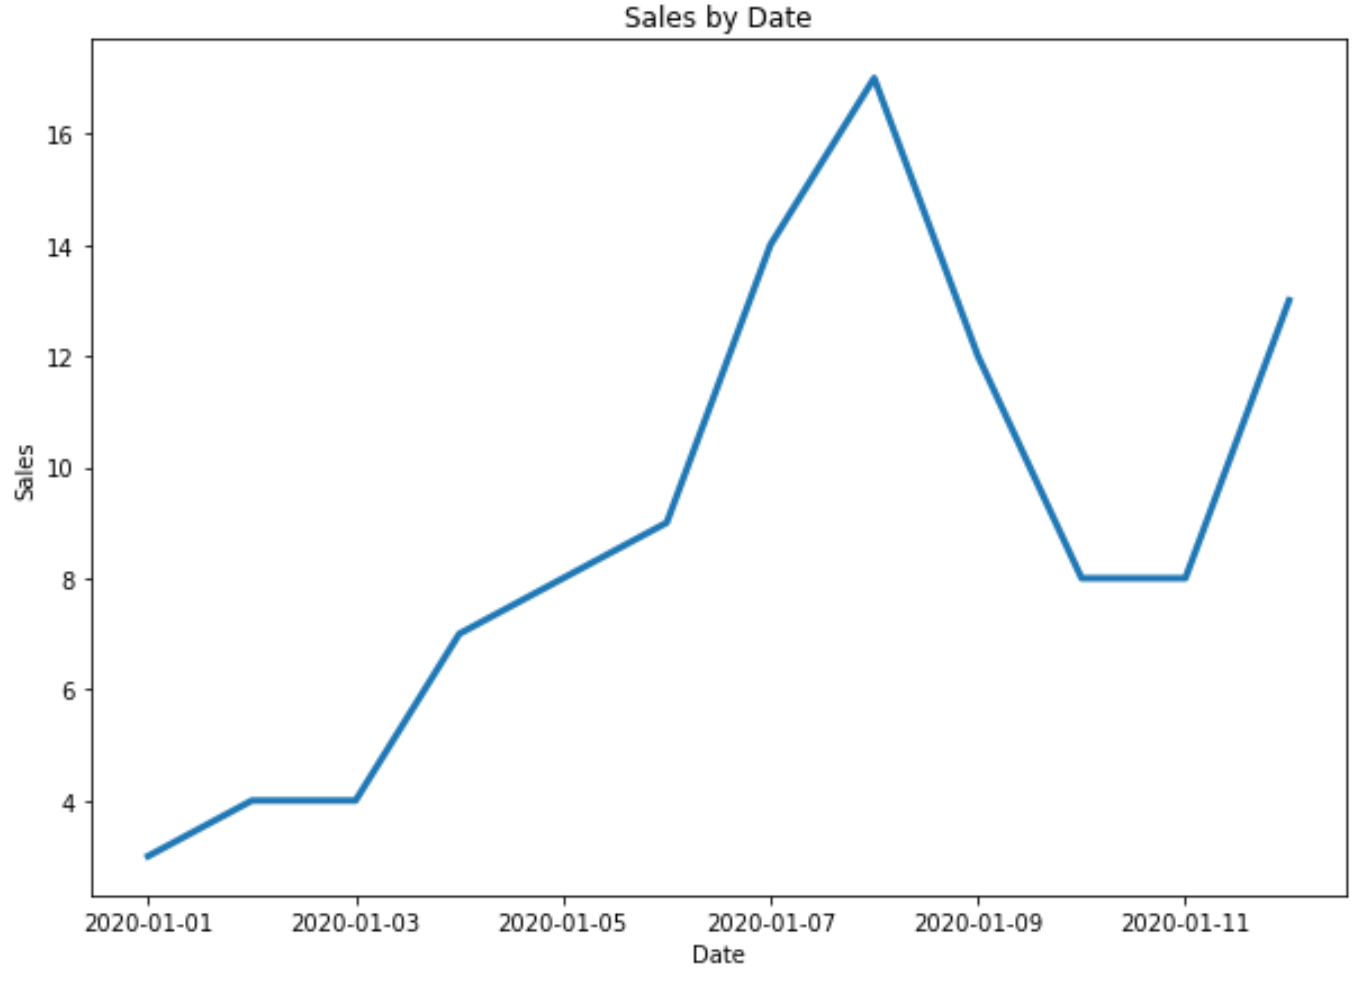
Grafiğe başlık ve eksen etiketleri eklemek için aşağıdaki kodu kullanabilirsiniz:
 import matplotlib. pyplot as plt
import datetime
import numpy as np
import pandas as pd

#define data
df = pd. DataFrame ({' date ': np. array ([datetime. datetime (2020, 1, i+1)
for i in range(12)]),
                   ' sales ': [3, 4, 4, 7, 8, 9, 14, 17, 12, 8, 8, 13]})

#plot time series
plt. plot (df. date , df. sales , linewidth= 3 )

#add title and axis labels
plt. title (' Sales by Date ')
plt. xlabel (' Date ')
plt. ylabel (' Sales ')

Örnek 3: Matplotlib’de birden fazla zaman serisinin grafiğini çizme
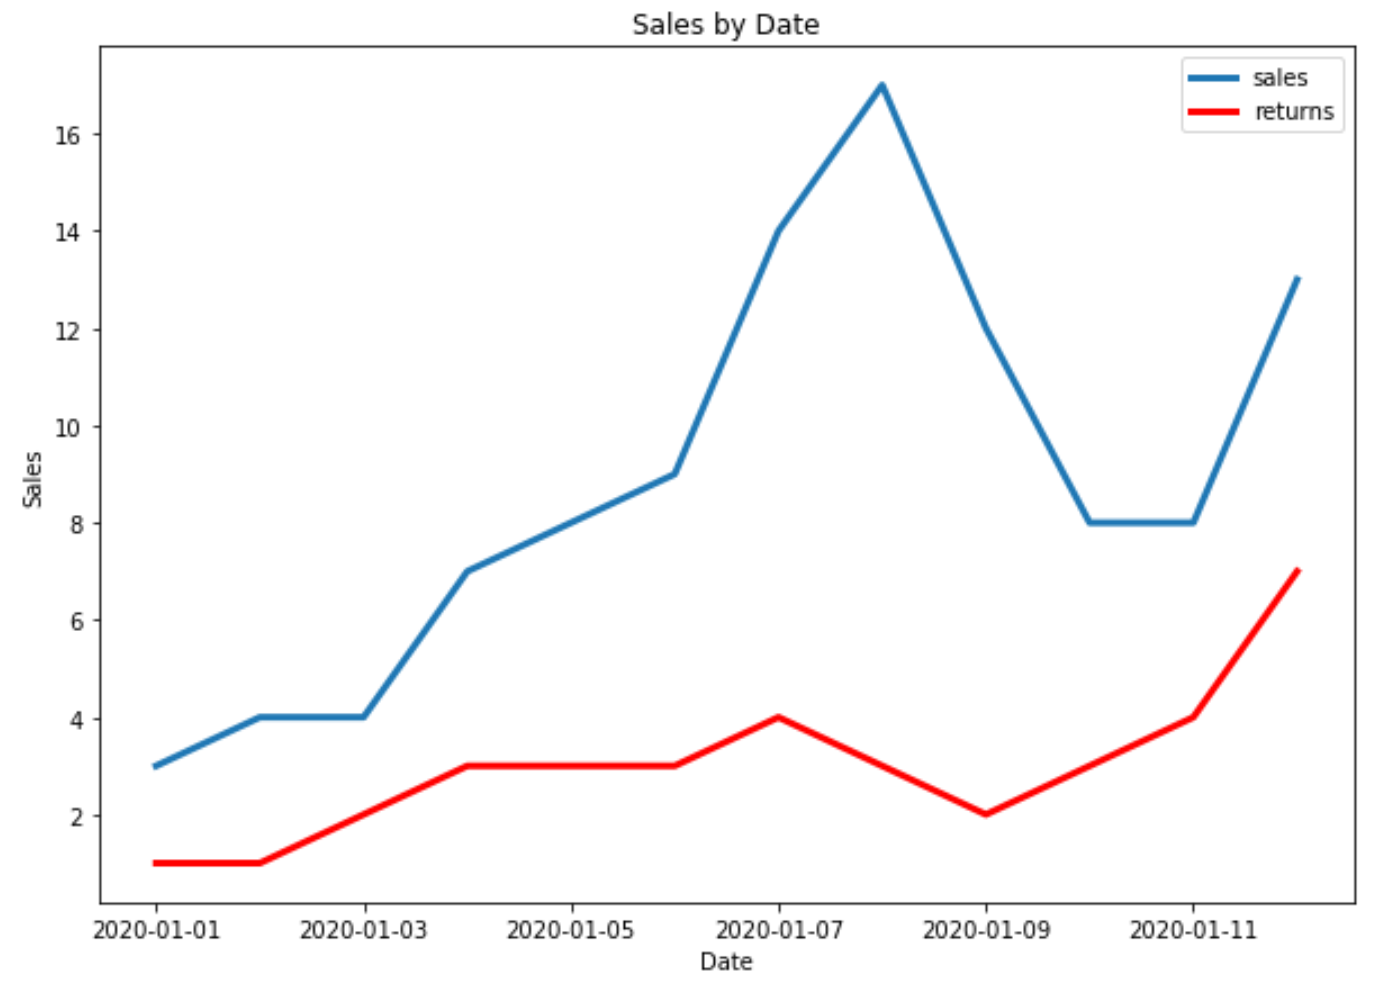
Aşağıdaki kod, Matplotlib’de birden fazla zaman serisinin tek bir grafikte nasıl çizileceğini gösterir:
 import matplotlib. pyplot as plt
import datetime
import numpy as np
import pandas as pd

#define data
df = pd. DataFrame ({' date ': np. array ([datetime. datetime (2020, 1, i+1)
                                     for i in range(12)]),
                   ' sales ': [3, 4, 4, 7, 8, 9, 14, 17, 12, 8, 8, 13]})

df2 = pd. DataFrame ({' date ': np. array ([datetime. datetime (2020, 1, i+1)
                                      for i in range(12)]),
                   ' returns ': [1, 1, 2, 3, 3, 3, 4, 3, 2, 3, 4, 7]})

#plot both time series
plt. plot ( df.date , df.sales , label=' sales ', linewidth= 3 )
plt. plot ( df2.date , df2.returns , color=' red ', label=' returns ', linewidth= 3 )

#add title and axis labels
plt. title (' Sales by Date ')
plt. xlabel (' Date ')
plt. ylabel (' Sales ')

#add legend
plt. legend ()

#displayplot
plt. show ()

Ek kaynaklar
Matplotlib: Gruba göre kutu grafikleri nasıl oluşturulur?
Matplotlib: Yığılmış Çubuk Grafikler Nasıl Oluşturulur