R'de en i̇yi uyum çizgisi nasıl çizilir (örneklerle)
R’ye en uygun çizgiyi çizmek için aşağıdaki yöntemlerden herhangi birini kullanabilirsiniz:
Yöntem 1: R tabanına en uygun çizgiyi çizin
 #create scatter plot of x vs. y
plot(x, y)

#add line of best fit to scatter plot
abline(lm(y ~ x))
Yöntem 2: ggplot2’de en uygun çizgiyi çizin
 library (ggplot2)

#create scatter plot with line of best fit
ggplot(df, aes (x=x, y=y)) +
    geom_point() +
    geom_smooth(method=lm, se= FALSE )
Aşağıdaki örnekler her yöntemin pratikte nasıl kullanılacağını göstermektedir.
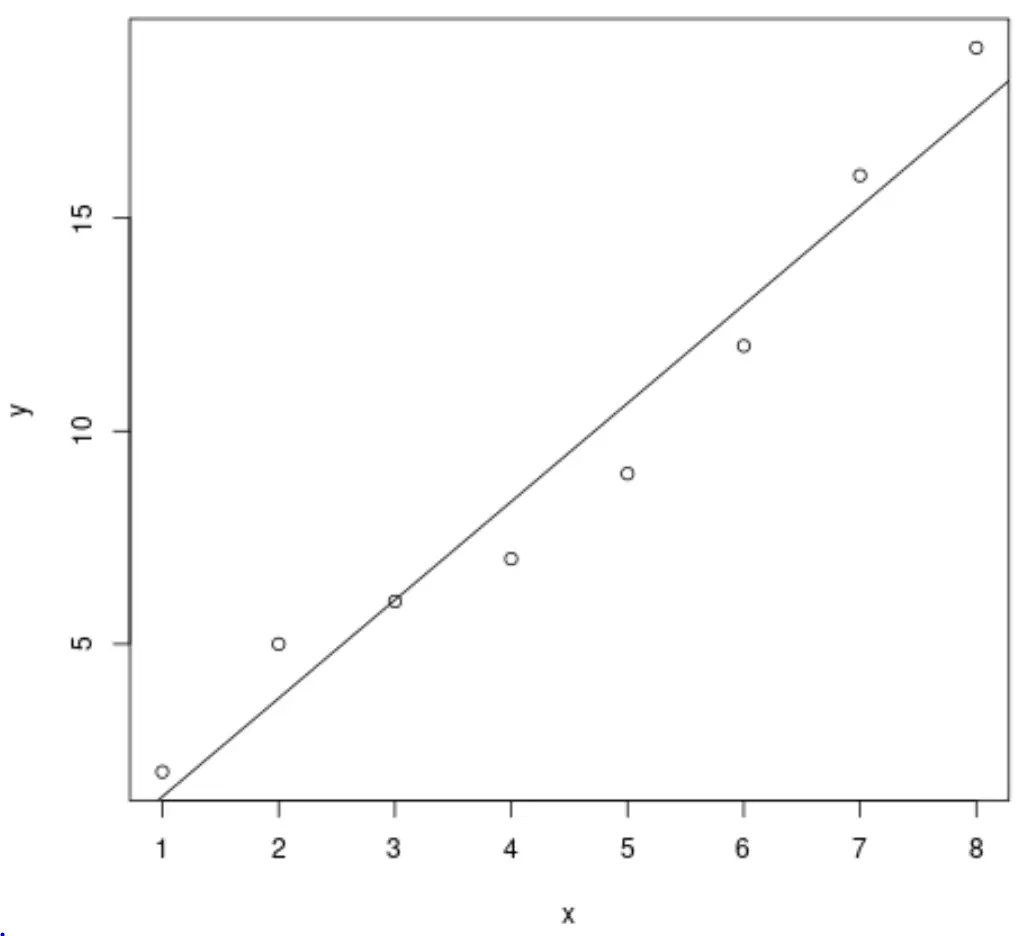
Örnek 1: R tabanına en uygun çizginin çizilmesi
Aşağıdaki kod, R tabanını kullanarak basit bir doğrusal regresyon modeli için en uygun çizginin nasıl çizileceğini gösterir:
 #define data
x <- c(1, 2, 3, 4, 5, 6, 7, 8)
y <- c(2, 5, 6, 7, 9, 12, 16, 19)

#create scatter plot of x vs. y
plot(x, y)

#add line of best fit to scatter plot
abline(lm(y ~ x))
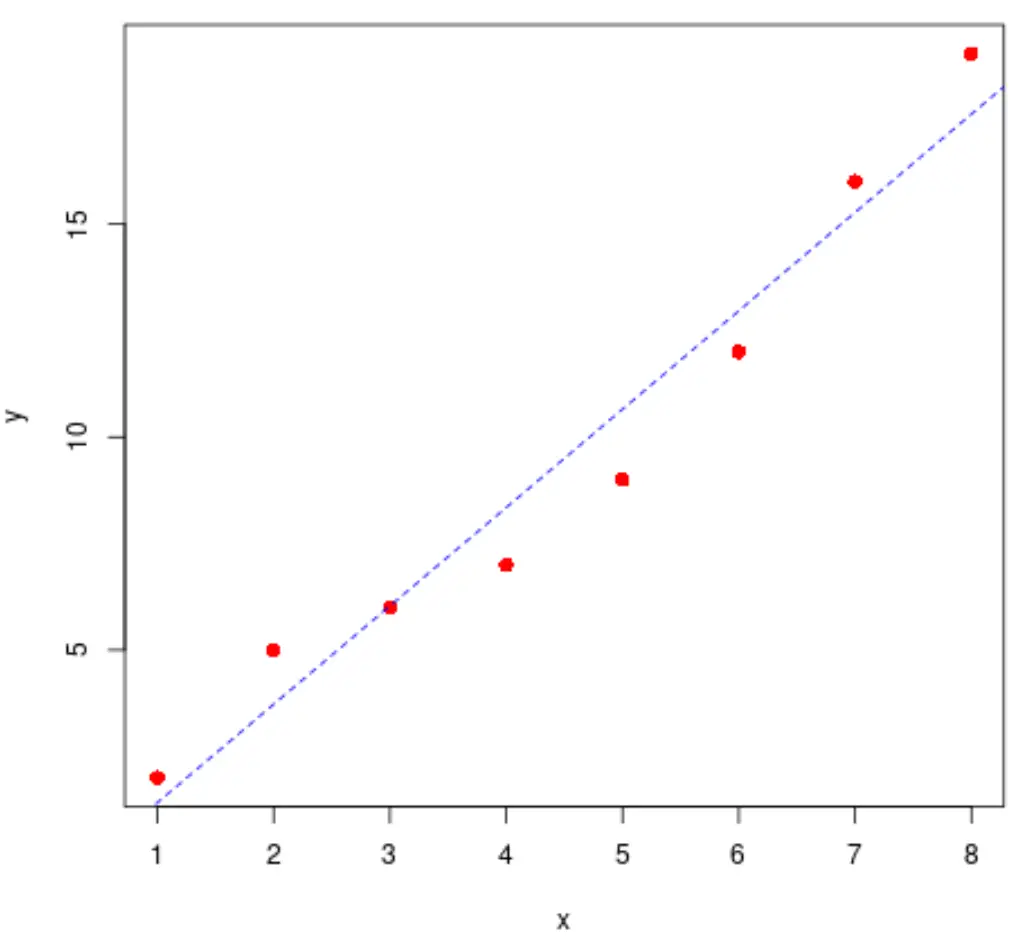
Noktaların ve çizginin stilini de değiştirmekten çekinmeyin:
 #define data
x <- c(1, 2, 3, 4, 5, 6, 7, 8)
y <- c(2, 5, 6, 7, 9, 12, 16, 19)

#create scatter plot of x vs. y
plot(x, y, pch= 16 , col=' red ', cex= 1.2 )

#add line of best fit to scatter plot
abline(lm(y ~ x), col=' blue ', lty=' dashed ')
En uygun çizgiyi hızlı bir şekilde hesaplamak için aşağıdaki kodu da kullanabiliriz:
 #find regression model coefficients
summary(lm(y ~ x))$coefficients

              Estimate Std. Error t value Pr(>|t|)
(Intercept) -0.8928571 1.0047365 -0.888648 4.084029e-01
x 2.3095238 0.1989675 11.607544 2.461303e-05
En iyi uyum çizgisi şu şekilde ortaya çıkıyor: y = -0,89 + 2,31x .
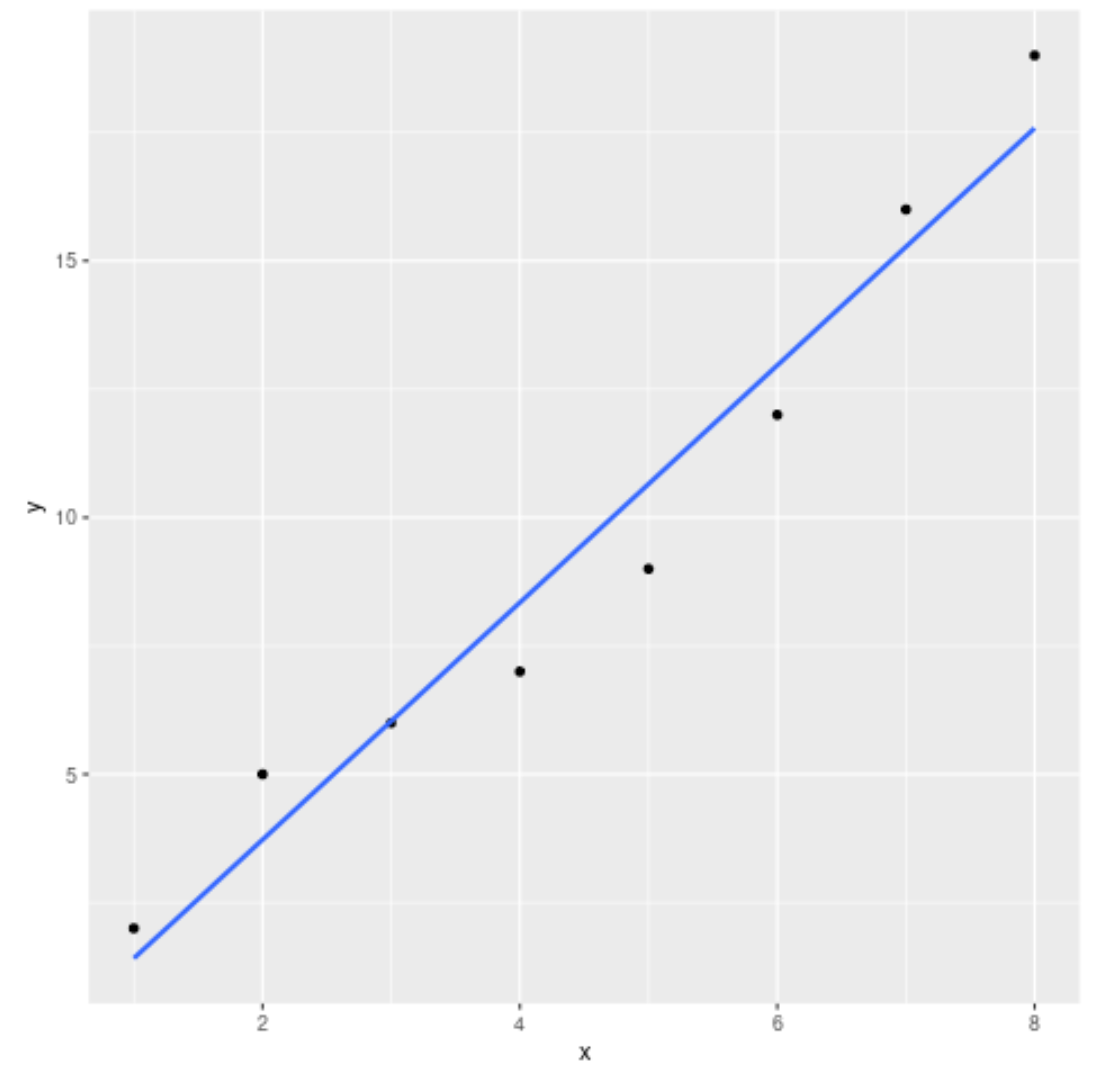
Örnek 2: ggplot2’de en uygun çizgiyi çizmek
Aşağıdaki kod, ggplot2 veri görselleştirme paketini kullanarak basit bir doğrusal regresyon modeli için en uygun çizginin nasıl çizileceğini gösterir:
 library (ggplot2)

#define data
df <- data. frame (x=c(1, 2, 3, 4, 5, 6, 7, 8),
y=c(2, 5, 6, 7, 9, 12, 16, 19))

#create scatter plot with line of best fit
ggplot(df, aes (x=x, y=y)) +
    geom_point() +
    geom_smooth(method=lm, se= FALSE )
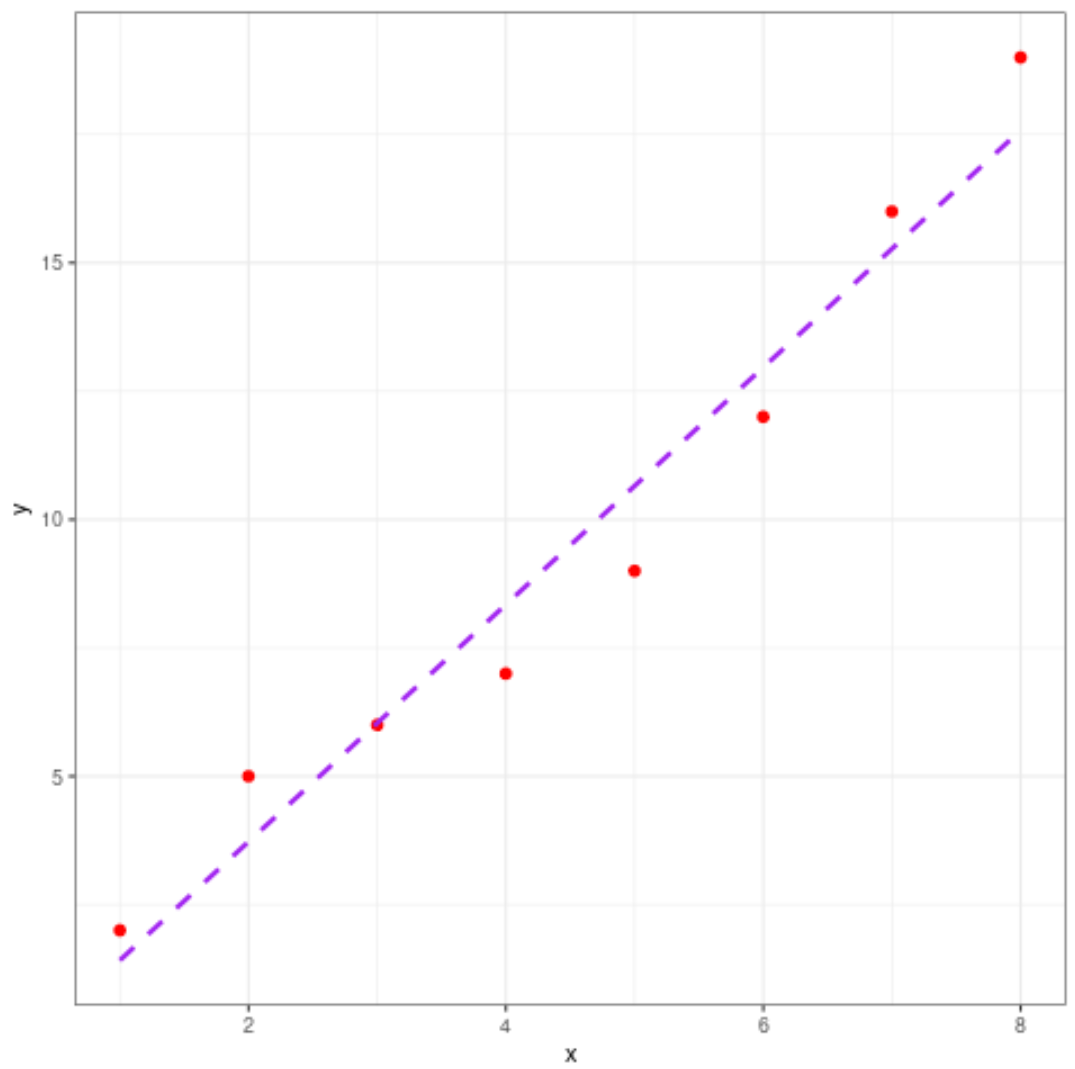
Olay örgüsünün estetiğini de değiştirmekten çekinmeyin:
 library (ggplot2)

#define data
df <- data. frame (x=c(1, 2, 3, 4, 5, 6, 7, 8),
y=c(2, 5, 6, 7, 9, 12, 16, 19))

#create scatter plot with line of best fit
ggplot(df, aes (x=x, y=y)) +
    geom_point(col=' red ', size= 2 ) +
    geom_smooth(method=lm, se= FALSE , col=' purple ', linetype=' dashed ') +
    theme_bw()
Ek kaynaklar
Aşağıdaki eğitimlerde R’de diğer yaygın işlemlerin nasıl gerçekleştirileceği açıklanmaktadır:
R’de basit doğrusal regresyon nasıl gerçekleştirilir
R’de çoklu doğrusal regresyon nasıl gerçekleştirilir
R’de regresyon çıktısı nasıl yorumlanır
yazar hakkında
Dr.benjamin anderson
Merhaba, ben Benjamin, emekli bir istatistik profesörü ve Statorials öğretmenine dönüştüm. İstatistik alanındaki kapsamlı deneyimim ve uzmanlığımla, öğrencilerimi Statorials aracılığıyla güçlendirmek için bilgilerimi paylaşmaya can atıyorum. Daha fazlasını bil