Як створити дзвоноподібну криву в python
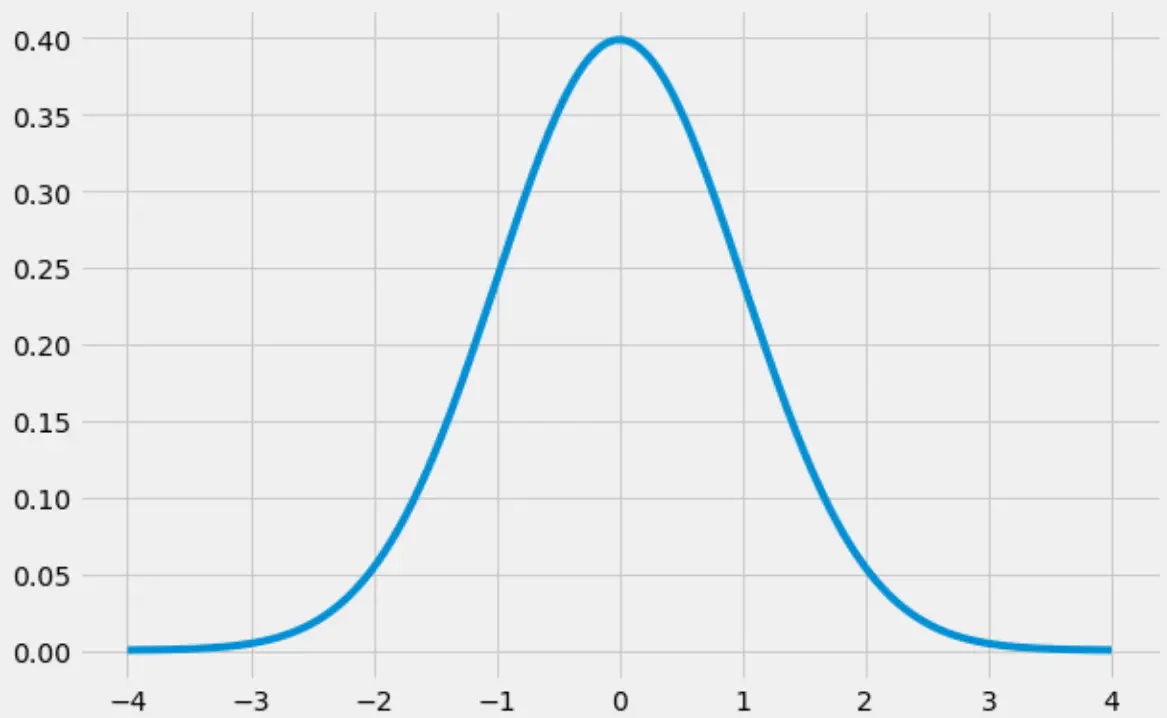
«Дзвоноподібна крива» — це прізвисько, дане формі нормального розподілу , яка має чітку «дзвонову» форму:

Цей підручник пояснює, як створити дзвоноподібну криву в Python.
Як створити дзвоноподібну криву в Python
Наступний код показує, як створити дзвоноподібну криву за допомогою бібліотек numpy , scipy та matplotlib :
 import numpy as np
import matplotlib.pyplot as plt
from scipy.stats import norm

#create range of x-values from -4 to 4 in increments of .001
x = np.arange(-4, 4, 0.001)

#create range of y-values that correspond to normal pdf with mean=0 and sd=1
y = norm.pdf(x,0,1)

#defineplot
fig, ax = plt.subplots(figsize=(9,6))
ax.plot(x,y)

#choose plot style and display the bell curve
plt.style.use('fivethirtyeight')
plt.show()

Як заповнити дзвоноподібну криву в Python
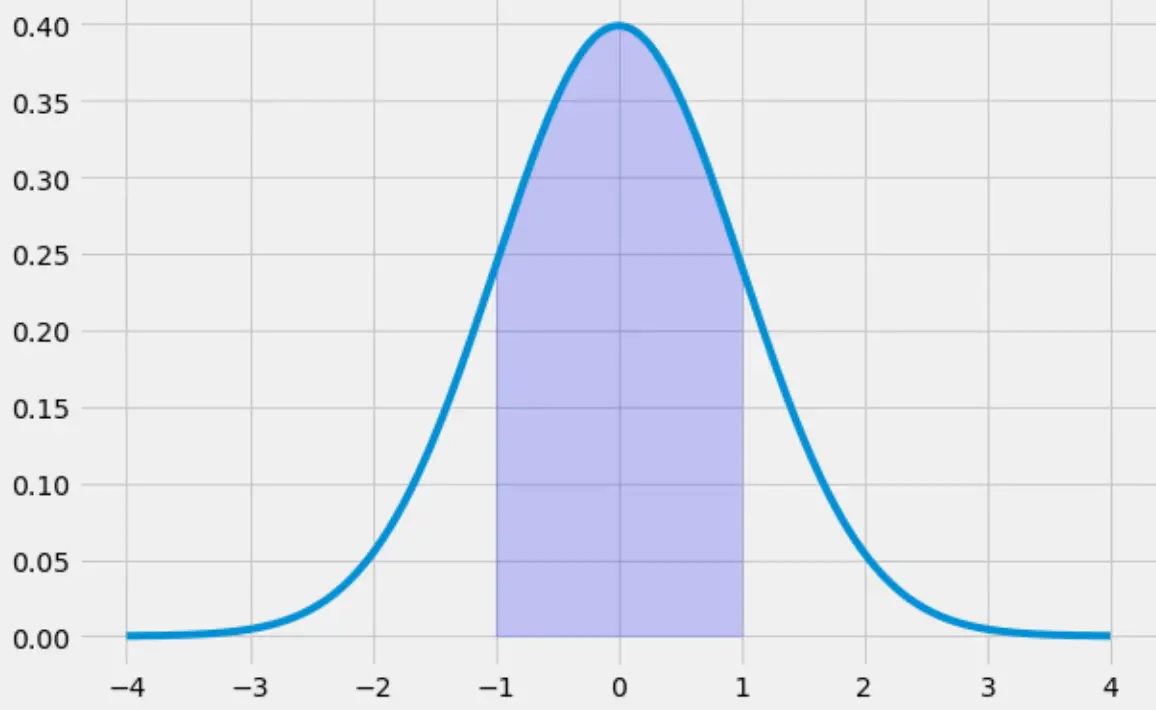
Наступний код ілюструє, як заповнити область під дзвоноподібною кривою від -1 до 1:
 x = np.arange(-4, 4, 0.001)
y = norm.pdf(x,0,1)

fig, ax = plt.subplots(figsize=(9,6))
ax.plot(x,y)

#specify the region of the bell curve to fill in
x_fill = np.arange(-1, 1, 0.001)
y_fill = norm.pdf(x_fill,0,1)
ax.fill_between(x_fill,y_fill,0, alpha=0.2, color='blue')

plt.style.use('fivethirtyeight')
plt.show()

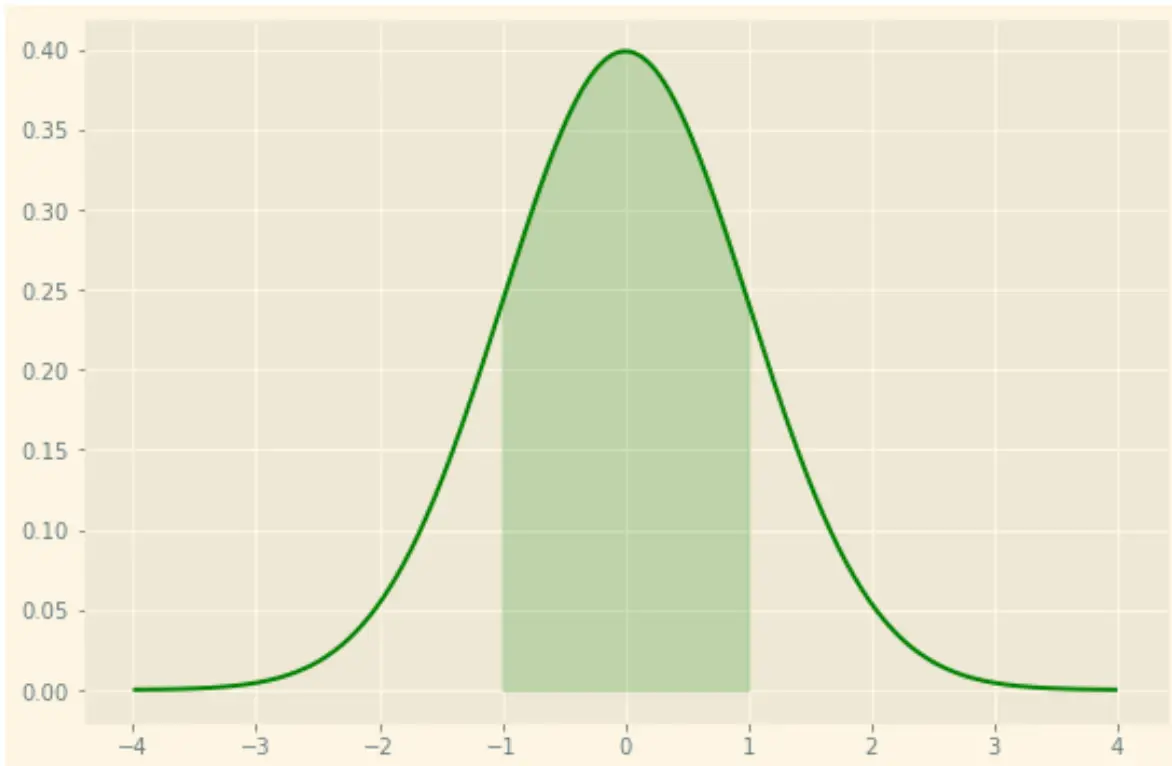
Зауважте, що ви також можете стилізувати графік як завгодно, використовуючи численні параметри стилю matplotlib . Наприклад, ви можете використовувати тему «сонячне світло» із зеленою лінією та зеленим затіненням:
 x = np.arange(-4, 4, 0.001)
y = norm.pdf(x,0,1)

fig, ax = plt.subplots(figsize=(9,6))
ax.plot(x,y, color=' green ')

#specify the region of the bell curve to fill in
x_fill = np.arange(-1, 1, 0.001)
y_fill = norm.pdf(x_fill,0,1)
ax.fill_between(x_fill,y_fill,0, alpha=0.2, color=' green ')

plt.style.use(' Solarize_Light2 ')
plt.show()

Ви можете знайти повний довідковий посібник із таблиць стилів для matplotlib тут .