Як побудувати розподіл хі-квадрат у python
Щоб побудувати графік розподілу хі-квадрат у Python, ви можете використовувати такий синтаксис:
 #x-axis ranges from 0 to 20 with .001 steps
x = np. arange (0, 20, 0.001)

#plot Chi-square distribution with 4 degrees of freedom
plt. plot (x, chi2. pdf (x, df= 4 ))
Масив x визначає діапазон осі x, а plt.plot() створює графік розподілу хі-квадрат із заданими ступенями свободи.
Наступні приклади показують, як використовувати ці функції на практиці.
Приклад 1: Побудова одного розподілу хі-квадрат
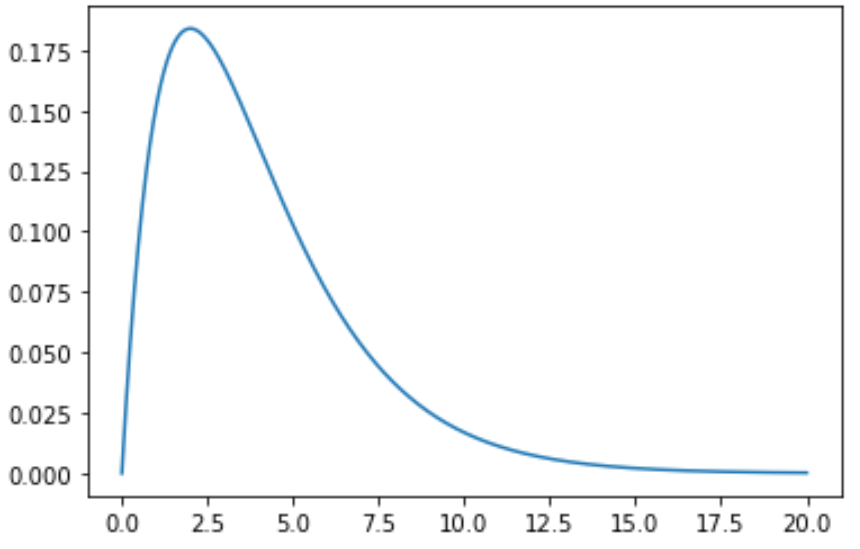
У наступному коді показано, як побудувати одну криву розподілу хі-квадрат із 4 ступенями свободи
 import numpy as np
import matplotlib. pyplot as plt
from scipy. stats import chi2

#x-axis ranges from 0 to 20 with .001 steps
x = np. arange (0, 20, 0.001)

#plot Chi-square distribution with 4 degrees of freedom
plt. plot (x, chi2. pdf (x, df= 4 ))

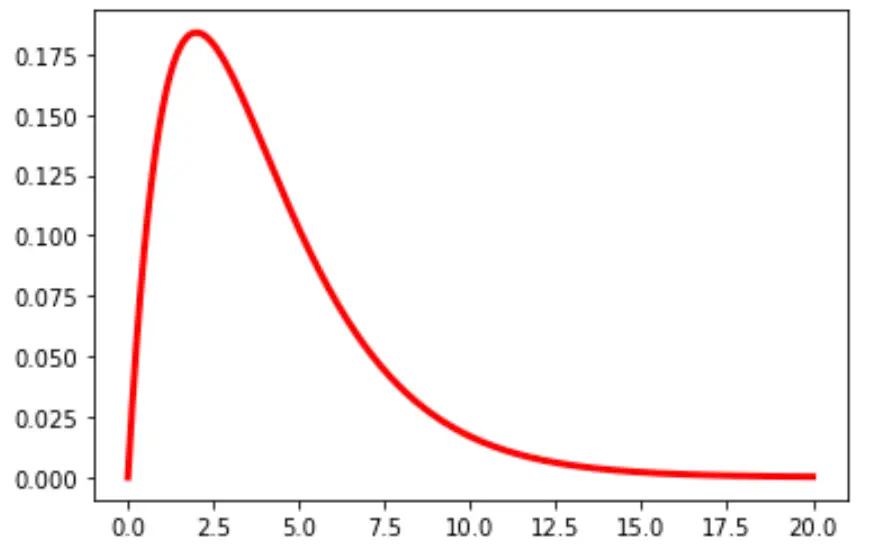
Ви також можете змінити колір і ширину лінії на діаграмі:
plt. plot (x, chi2. pdf (x, df= 4 ), color=' red ', linewidth= 3 )

Приклад 2: Побудова кількох розподілів хі-квадрат
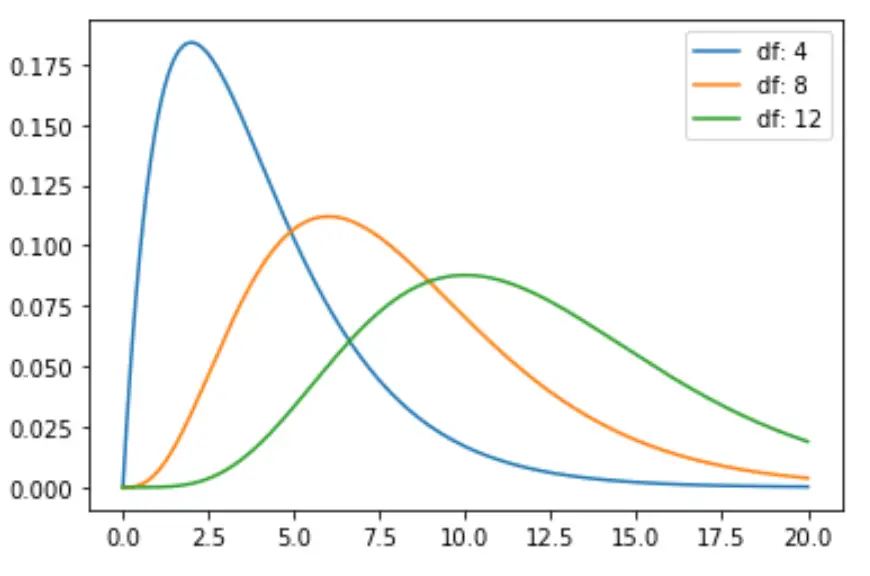
У наступному коді показано, як побудувати кілька кривих розподілу хі-квадрат із різними ступенями свободи:
 import numpy as np
import matplotlib. pyplot as plt
from scipy. stats import chi2

#x-axis ranges from 0 to 20 with .001 steps
x = np. arange (0, 20, 0.001)

#define multiple Chi-square distributions
plt. plot (x, chi2. pdf (x, df= 4 ), label=' df: 4 ')
plt. plot (x, chi2. pdf (x, df= 8 ), label=' df: 8 ')
plt. plot (x, chi2. pdf (x, df= 12 ), label=' df: 12 ')

#add legend to plot
plt. legend ()

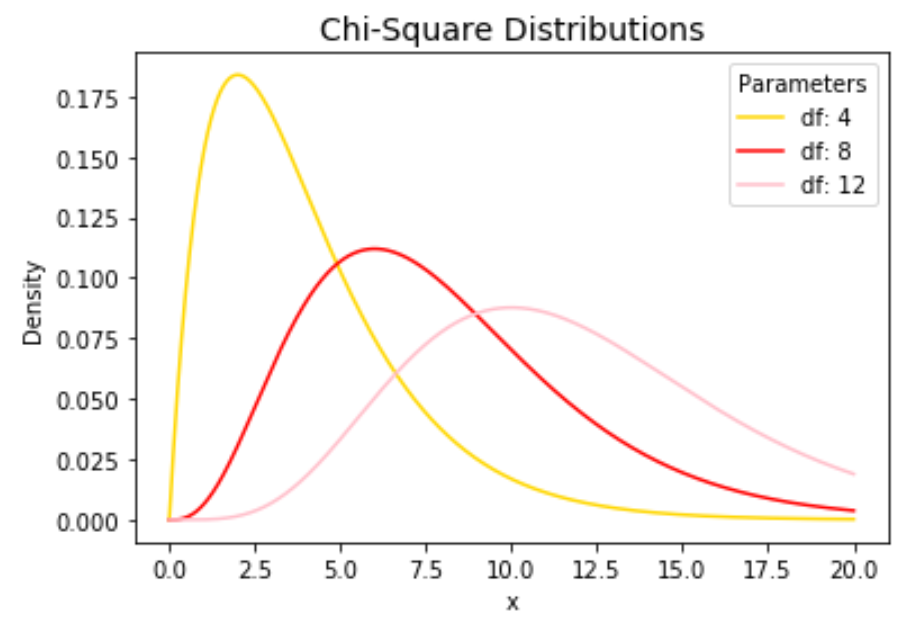
Не соромтеся змінювати кольори ліній і додавати заголовок і мітки осей, щоб завершити діаграму:
 import numpy as np
import matplotlib. pyplot as plt
from scipy. stats import chi2

#x-axis ranges from 0 to 20 with .001 steps
x = np. arange (0, 20, 0.001)

#define multiple Chi-square distributions
plt. plot (x, chi2. pdf (x, df= 4 ), label=' df: 4 ', color=' gold ')
plt. plot (x, chi2. pdf (x, df= 8 ), label=' df: 8 ', color=' red ')
plt. plot (x, chi2. pdf (x, df= 12 ), label=' df: 12 ', color=' pink ')

#add legend to plot
plt. legend (title=' Parameters ')

#add axes labels and a title
plt. ylabel (' Density ')
plt. xlabel (' x ')
plt. title (' Chi-Square Distributions ', fontsize= 14 )

Зверніться до документації matplotlib для детального пояснення функції plt.plot() .