Як створити свічкову діаграму за допомогою matplotlib у python
Свічкова діаграма — це різновид фінансової діаграми, яка відображає рух цін на цінні папери з часом.
У наступному прикладі показано, як створити свічкову діаграму за допомогою бібліотеки візуалізації Matplotlib у Python.
Приклад: створення свічкової діаграми в Python
Скажімо, у нас є такий пандас DataFrame, який показує ціну відкриття, закриття, високу та низьку ціну певної акції за 8-денний період:
 import pandas as pd

#createDataFrame
prices = pd. DataFrame ({' open ': [25, 22, 21, 19, 23, 21, 25, 29],
                       ' close ': [24, 20, 17, 23, 22, 25, 29, 31],
                       ' high ': [28, 27, 29, 25, 24, 26, 31, 37],
                       ' low ': [22, 16, 14, 17, 19, 18, 22, 26]},
                       index=pd. date_range (" 2021-01-01 ", periods=8, freq=" d "))

#display DataFrame
print (prices)

            open close high low
2021-01-01 25 24 28 22
2021-01-02 22 20 27 16
2021-01-03 21 17 29 14
2021-01-04 19 23 25 17
2021-01-05 23 22 24 19
2021-01-06 21 25 26 18
2021-01-07 25 29 31 22
2021-01-08 29 31 37 26
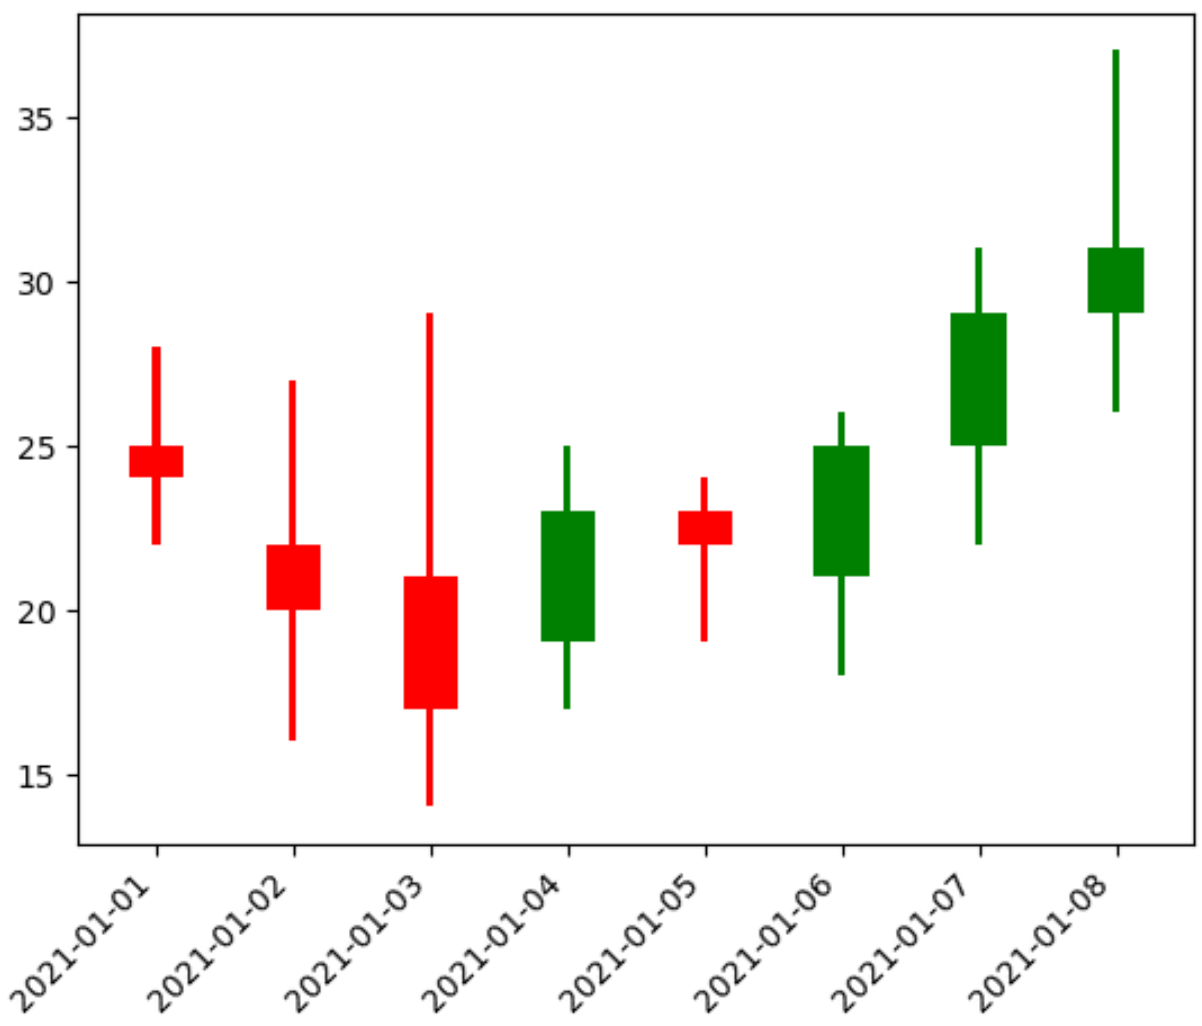
Ми можемо використати наступний код, щоб створити свічкову діаграму, щоб візуалізувати рух ціни цієї акції протягом цього 8-денного періоду:
 import matplotlib. pyplot as plt

#create figure
plt. figure ()

#define width of candlestick elements
width = .4
width2 = .05

#define up and down prices
up = prices[prices. close >=prices. open ]
down = prices[prices. close <prices. open ]

#define colors to use
col1 = ' green '
col2 = ' red '

#plot up prices
plt. bar (up. index , up. close -up. open , width, bottom=up. open , color=col1)
plt. bar (up. index ,up. high -up. close ,width2,bottom=up. close ,color=col1)
plt. bar (up. index , up. low -up. open , width2, bottom=up. open , color=col1)

#plot down prices
plt. bar (down. index , down. close -down. open , width, bottom=down. open , color=col2)
plt. bar (down. index , down. high -down. open , width2, bottom=down. open , color=col2)
plt. bar (down. index ,down. low -down. close ,width2,bottom=down. close ,color=col2)

#rotate x-axis tick labels
plt. xticks (rotation= 45 , ha=' right ')

#display candlestick chart
plt. show ()

Кожна свічка відображає зміну ціни цінного паперу в певний день. Колір свічки говорить нам, чи ціна закрилася вище (зелений) чи нижче (червоний) порівняно з попереднім днем.
Не соромтеся змінювати ширину свічників і кольори, які використовуються, щоб діаграма виглядала так, як вам потрібно.
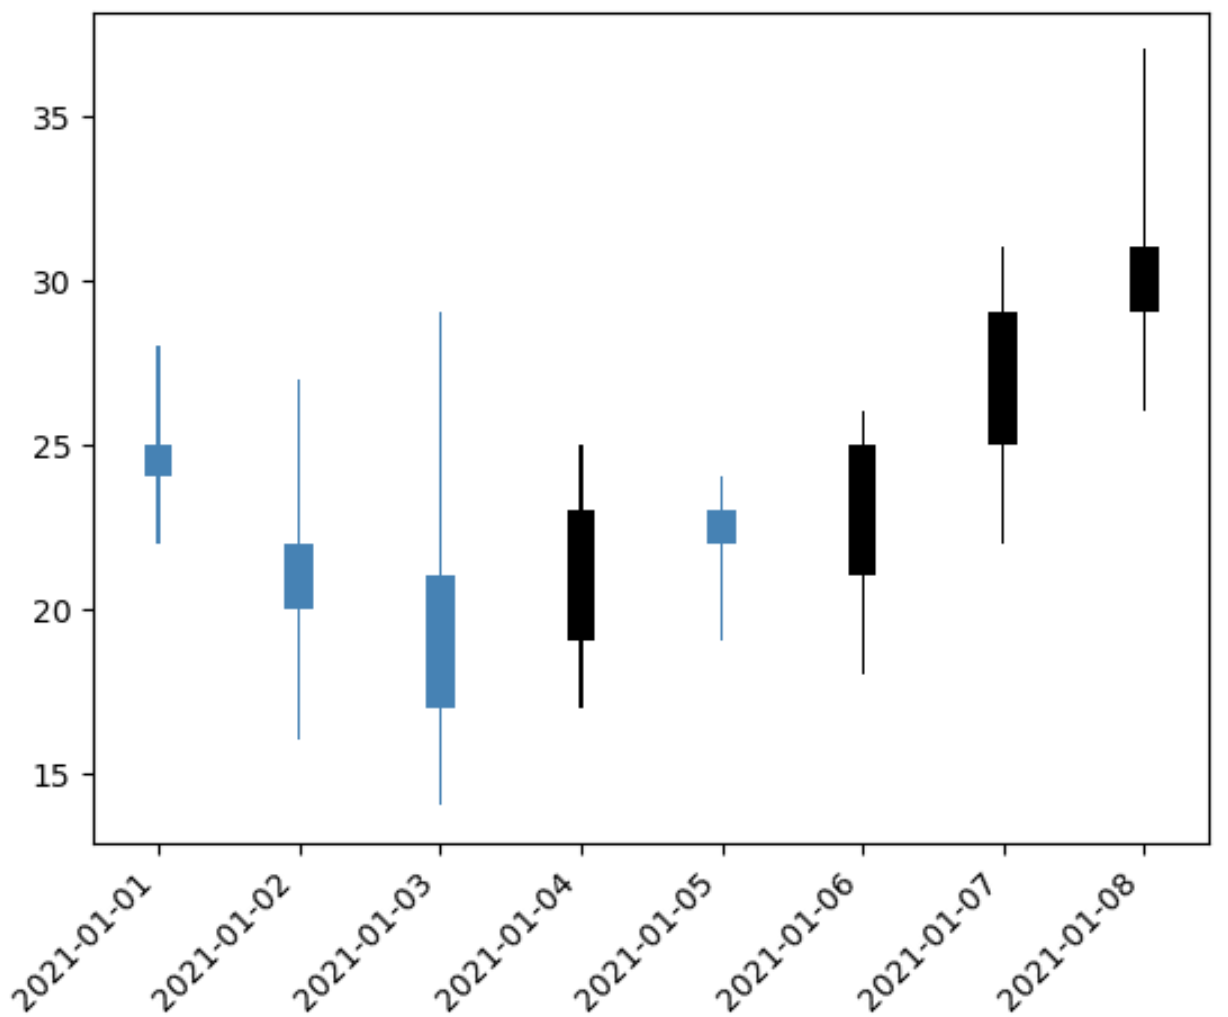
Наприклад, ми могли б зробити свічки ще тоншими та використовувати різні кольори для позначення «високих» і «низьких» днів:
 import matplotlib. pyplot as plt

#create figure
plt. figure ()

#define width of candlestick elements
width = .2
width2 = .02

#define up and down prices
up = prices[prices. close >=prices. open ]
down = prices[prices. close <prices. open ]

#define colors to use
col1 = ' black '
col2 = ' steelblue '

#plot up prices
plt. bar (up. index , up. close -up. open , width, bottom=up. open , color=col1)
plt. bar (up. index ,up. high -up. close ,width2,bottom=up. close ,color=col1)
plt. bar (up. index , up. low -up. open , width2, bottom=up. open , color=col1)

#plot down prices
plt. bar (down. index , down. close -down. open , width, bottom=down. open , color=col2)
plt. bar (down. index , down. high -down. open , width2, bottom=down. open , color=col2)
plt. bar (down. index ,down. low -down. close ,width2,bottom=down. close ,color=col2)

#rotate x-axis tick labels
plt. xticks (rotation= 45 , ha=' right ')

#display candlestick chart
plt. show ()

Додаткові ресурси
У наступних посібниках пояснюється, як створювати інші типові діаграми в Python:
Як створити кілька графіків Matplotlib на одній фігурі
Як побудувати гістограму зі списку даних у Python
Як створити коробкові діаграми за групою в Python