Як побудувати часовий ряд у matplotlib (з прикладами)
Ви можете використовувати такий синтаксис для побудови часових рядів у Matplotlib:
 import matplotlib. pyplot as plt

plt. plot (df. x , df. y )
Це передбачає, що змінна x належить до класу datetime.datetime() .
У наведених нижче прикладах показано, як використовувати цей синтаксис для побудови даних часових рядів у Python.
Приклад 1: побудуйте базовий часовий ряд у Matplotlib
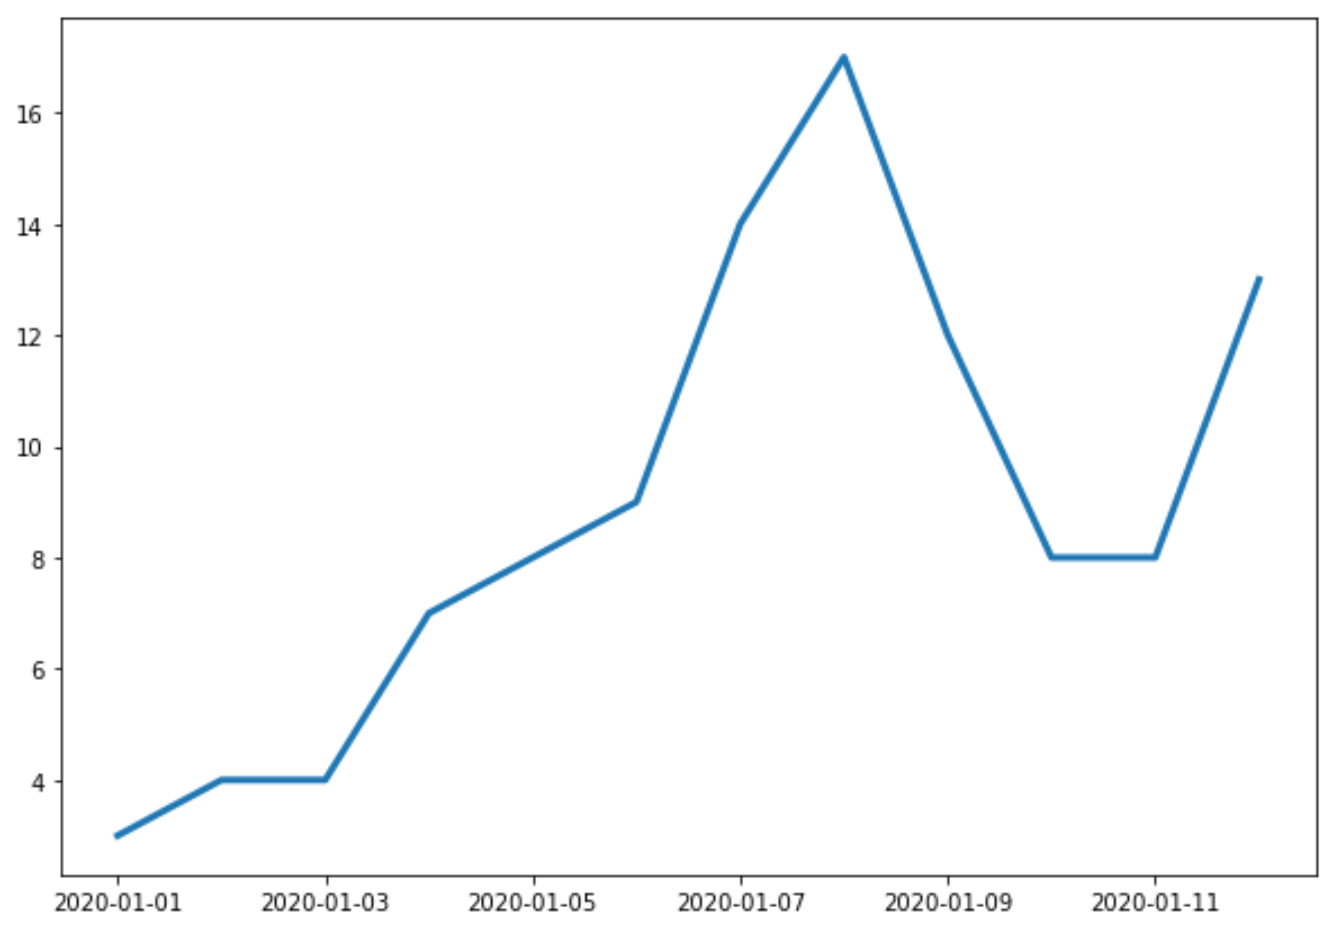
Наступний код показує, як побудувати часовий ряд у Matplotlib, який показує загальні продажі, здійснені компанією протягом 12 днів поспіль:
 import matplotlib. pyplot as plt
import datetime
import numpy as np
import pandas as pd

#define data
df = pd. DataFrame ({' date ': np. array ([datetime. datetime (2020, 1, i+1)
for i in range(12)]),
                   ' sales ': [3, 4, 4, 7, 8, 9, 14, 17, 12, 8, 8, 13]})

#plot time series
plt. plot (df. date , df. sales , linewidth= 3 )

На осі Х показано дату, а на осі Y – загальний обсяг продажів за кожну дату.
Приклад 2: Налаштування міток заголовка та осі
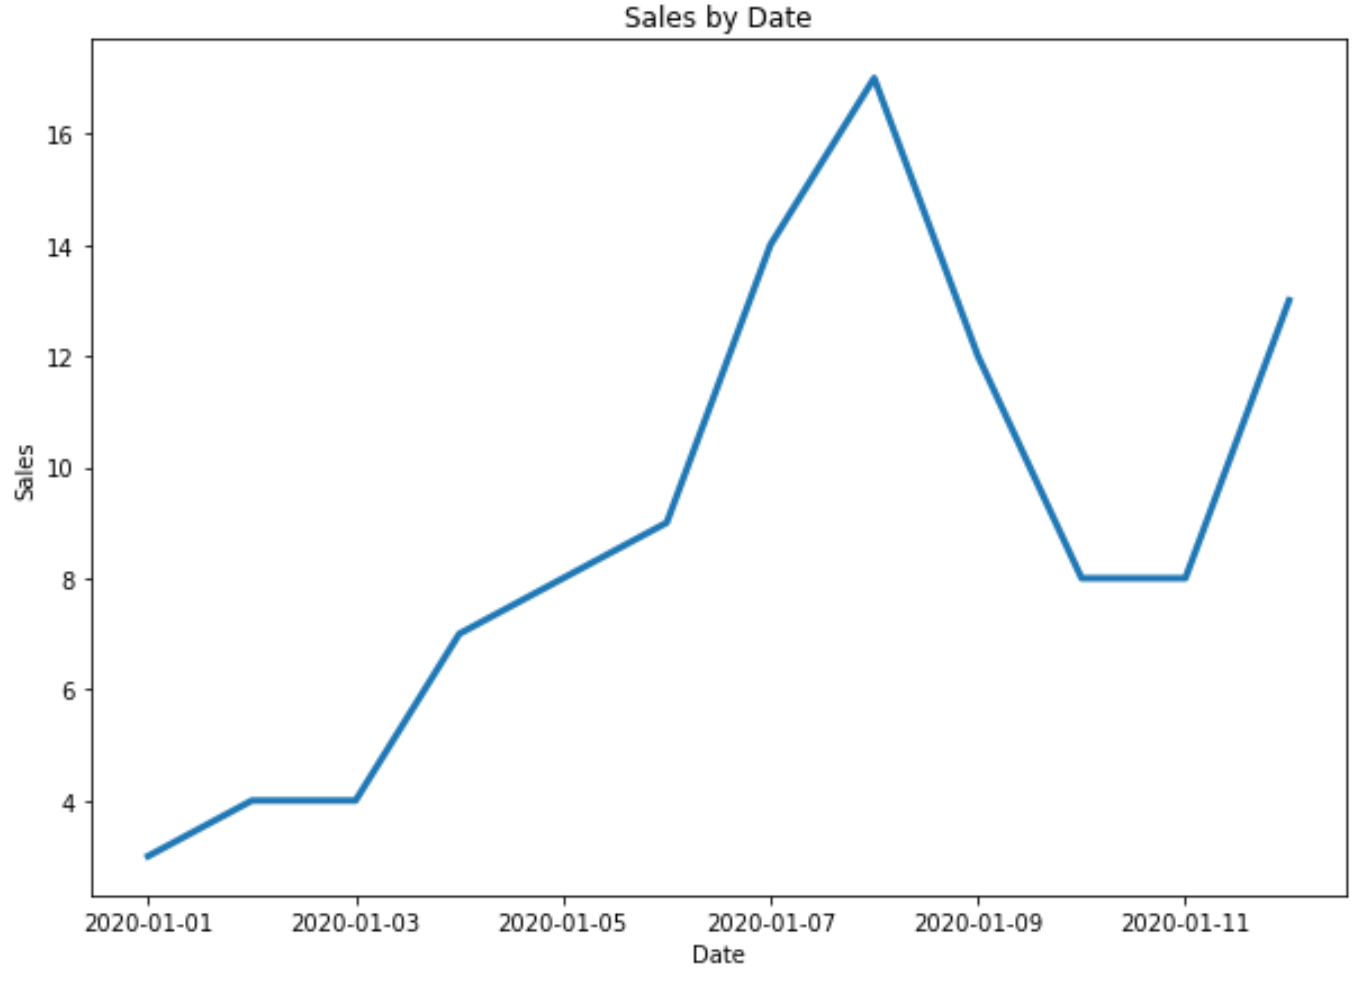
Ви можете використовувати наступний код, щоб додати заголовок і мітки осей до діаграми:
 import matplotlib. pyplot as plt
import datetime
import numpy as np
import pandas as pd

#define data
df = pd. DataFrame ({' date ': np. array ([datetime. datetime (2020, 1, i+1)
for i in range(12)]),
                   ' sales ': [3, 4, 4, 7, 8, 9, 14, 17, 12, 8, 8, 13]})

#plot time series
plt. plot (df. date , df. sales , linewidth= 3 )

#add title and axis labels
plt. title (' Sales by Date ')
plt. xlabel (' Date ')
plt. ylabel (' Sales ')

Приклад 3: побудуйте кілька часових рядів у Matplotlib
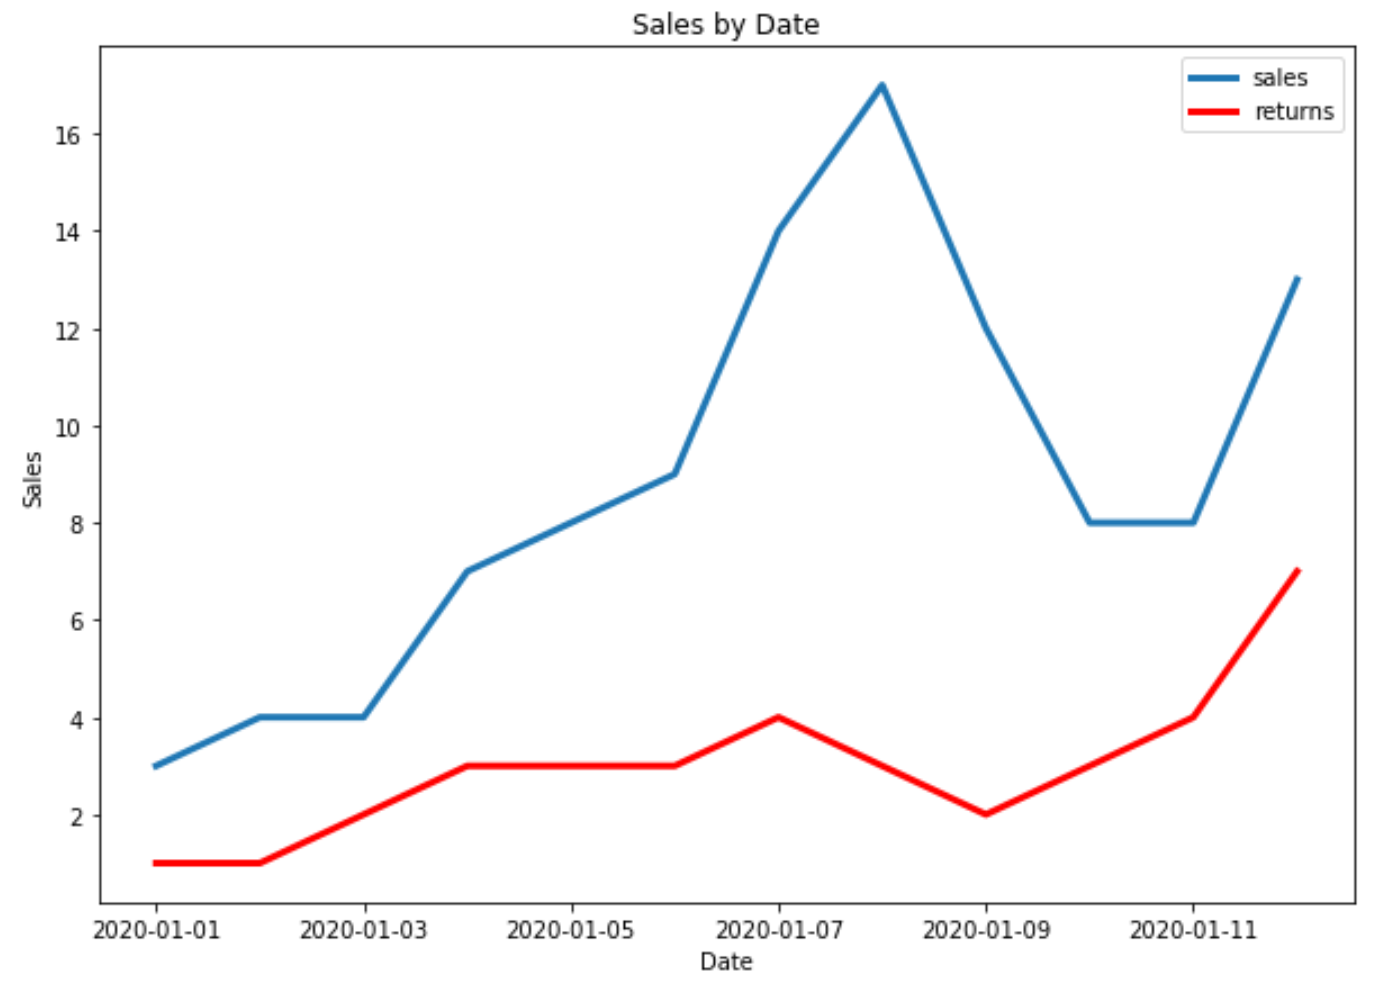
Наступний код показує, як побудувати кілька часових рядів на одному графіку в Matplotlib:
 import matplotlib. pyplot as plt
import datetime
import numpy as np
import pandas as pd

#define data
df = pd. DataFrame ({' date ': np. array ([datetime. datetime (2020, 1, i+1)
                                     for i in range(12)]),
                   ' sales ': [3, 4, 4, 7, 8, 9, 14, 17, 12, 8, 8, 13]})

df2 = pd. DataFrame ({' date ': np. array ([datetime. datetime (2020, 1, i+1)
                                      for i in range(12)]),
                   ' returns ': [1, 1, 2, 3, 3, 3, 4, 3, 2, 3, 4, 7]})

#plot both time series
plt. plot ( df.date , df.sales , label=' sales ', linewidth= 3 )
plt. plot ( df2.date , df2.returns , color=' red ', label=' returns ', linewidth= 3 )

#add title and axis labels
plt. title (' Sales by Date ')
plt. xlabel (' Date ')
plt. ylabel (' Sales ')

#add legend
plt. legend ()

#displayplot
plt. show ()

Додаткові ресурси
Matplotlib: Як створити коробкові діаграми за групою
Matplotlib: як створити стовпчасту діаграму з накопиченням